3 ASX Stocks Everyone Missed That Could Be Ready to Soar

By Fil Tortevski and Pedro Banales
There is an old saying in the market that the best moves often happen when no one is looking. While headlines tend to focus on the largest and most well-known companies, some of the most compelling opportunities are quietly forming in the parts of the market that most investors overlook.
In a recent episode of the Hot Stock Tips show, Wealth Within's Filip Tortevski and senior analyst Pedro Banales examined 3 ASX stocks sitting outside the ASX 300 that are showing early signs of significant upside potential. These are not the kinds of stocks making the evening news, but the chart setups suggest they deserve a closer look.
For those who are new to understanding how the share market works and how to identify these kinds of opportunities, our guide on the stock market for beginners is an excellent starting point that covers the foundational concepts every investor needs.
Why Looking Beyond the Headlines Matters
Most investors naturally gravitate toward the biggest names on the ASX. The top 50 or top 100 stocks attract the lion's share of media attention, analyst coverage, and institutional money. There is nothing wrong with that approach, and in fact it remains the safest starting point for most people.
However, when you develop the skills to read charts and identify where money is flowing, you start to notice that opportunities exist across the entire market, including in stocks that sit well outside the major indices.
The key, as Filip and Pedro emphasised during the show, is knowing what to look for. Identifying when a stock's character is changing, when volume is picking up, when a long period of accumulation is finally giving way to a new uptrend; these are the skills that separate traders who consistently profit from those who get caught on the wrong side.
It is also worth noting that trading stocks outside the top end of the market carries additional risk, particularly around liquidity, which is why having a structured education and a solid trading plan matters so much.
Capral Limited, Australia's Largest Aluminium Extrusion Manufacturer
The first stock analysed was Capral Limited, Australia's largest manufacturer and distributor of aluminium extrusion products used across the construction, transport, and industrial sectors. What makes Capral particularly interesting right now is the context in which it is performing.
At a time when heightened geopolitical tensions and market volatility are dragging many stocks lower, Capral has been holding up remarkably well, and that relative strength is itself a bullish signal.
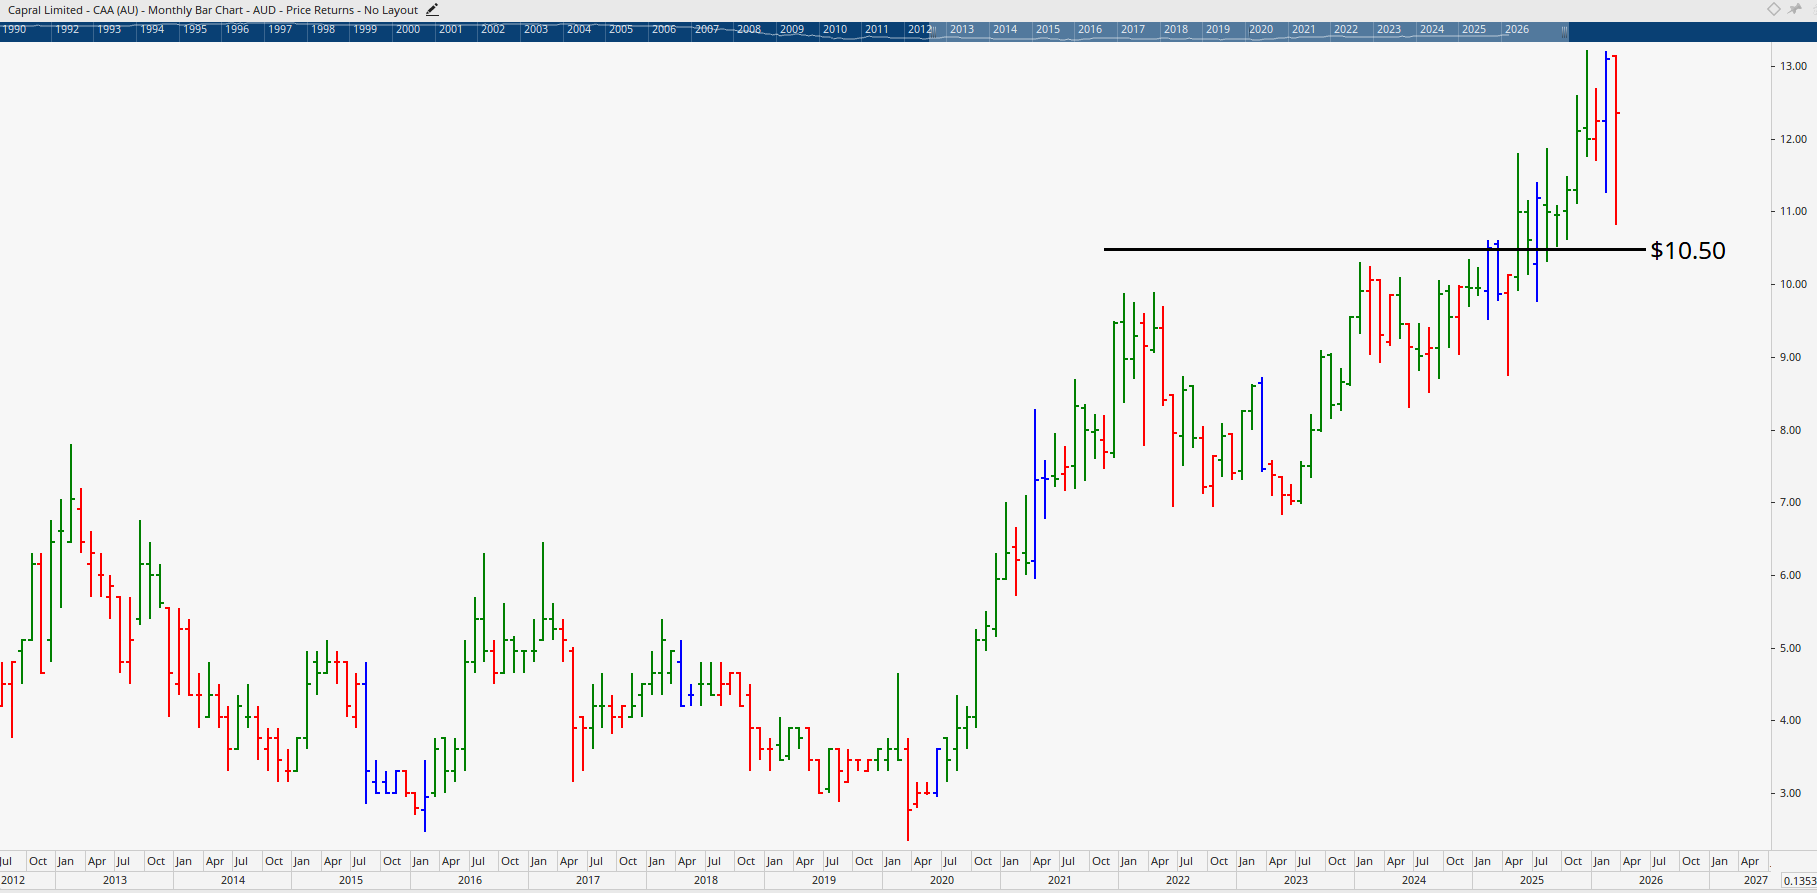
Looking at the monthly chart, Capral has been through a prolonged correction over several years, followed by an extended basing pattern often referred to as an accumulation phase. This is a period where the stock essentially trades sideways at lower levels while smart money quietly builds positions. The stock has now broken out of that base and is in the early stages of what could be a significant new uptrend.
The critical level to watch is around the $10.50 mark. This was a level that acted as resistance back in 2022 and again through 2024. After several attempts, the stock finally broke through convincingly, and what was once resistance now appears to be acting as support.
As long as Capral holds above this zone, the bullish momentum remains intact, and the potential upside is substantial. Filip noted that the stock could potentially challenge highs back around the $38 mark over the medium to longer term, which would represent a significant return from current levels.
Volume analysis also supports the bullish case. The pullbacks have occurred on relatively low volume, which suggests that selling pressure is limited and that buyers remain in control. Pedro added an important educational point here about the opportunity cost of capital.
Many investors buy stocks during sideways or declining phases and then sit in them for years waiting for something to happen. In Capral's case, the basing period lasted roughly 9 years. Understanding chart analysis allows you to avoid that trap and instead enter when the momentum is already turning in your favour.
Antipa Minerals: Gold and Copper Exploration in Western Australia
The second stock on the radar was Antipa Minerals, a Western Australian gold and copper exploration company focused on large-scale discoveries in the Paterson Province. Unlike many speculative explorers, Antipa has a track record stretching back to its initial public offering in 2011, which gives analysts enough price history to identify meaningful patterns and cyclical behaviour.
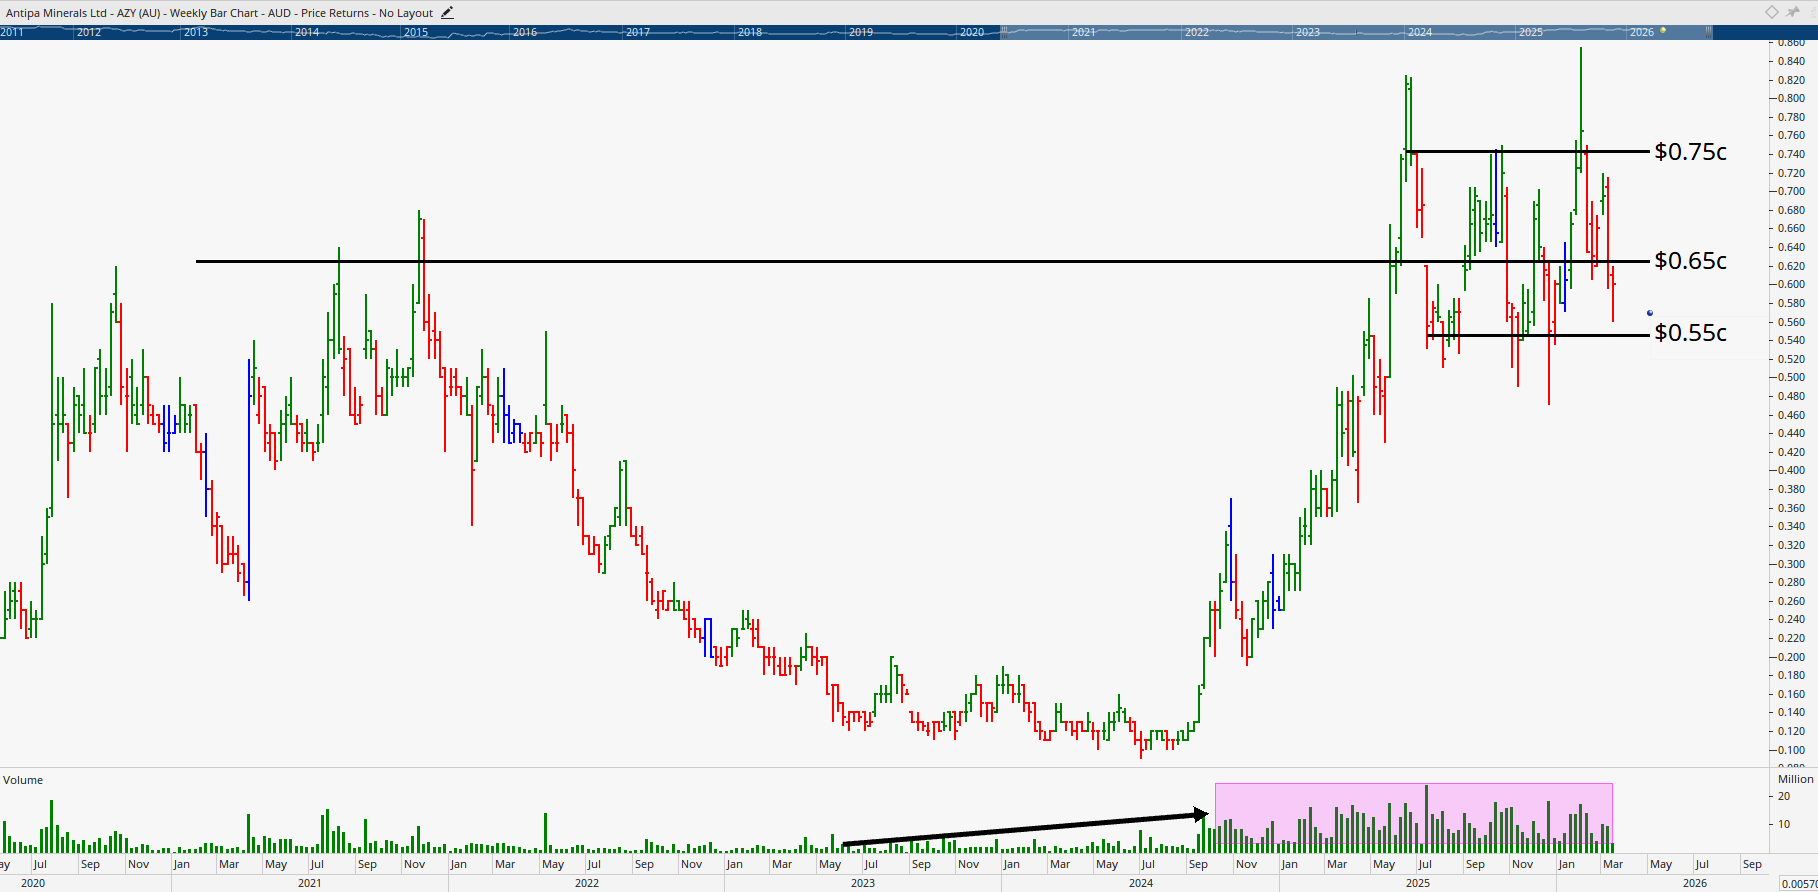
On the monthly chart, the stock is trading around the 65-cent level, which is significant because this was previously a price zone where the stock reversed sharply to the downside. The fact that it is now managing to hold around this area rather than immediately pulling back suggests that something has changed in the way the market is valuing the company.
Pedro noted that if Antipa can break convincingly above the 75-cent resistance level that caps the current trading range, it has the potential to move toward the $1.80 mark, which would represent close to a tripling from current levels.
One of the most important observations made during the analysis was about liquidity. The volume profile on Antipa has changed dramatically in recent months. Where the stock was once thinly traded, it is now attracting significantly more buying and selling activity. This is crucial because liquidity determines how easily you can enter and exit a position. A stock with no buyers on the other side when you want to sell is a dangerous proposition, and it is one of the reasons why trading smaller stocks requires more skill and experience.
The current trading range sits between roughly 55 cents on the downside and 75 cents on the upside. A break above that upper band would be the bullish signal traders are watching for, while a break below 55 cents would shift the outlook to the downside.
For now, the stock is consolidating, and the changed character of its price action and volume suggests that this consolidation may resolve to the upside. Those wanting to develop a deeper understanding of how to read these kinds of chart setups and cycle phases may want to explore the Diploma of Share Trading and Investment, which covers these techniques in detail across its 5-module structure.
Fineos Corporation: Cloud-Based Insurance Software
The third and final stock discussed was Fineos Corporation, trading under the code FCL. Fineos is an Irish-based software company that provides cloud-based core systems for life, accident, and health insurance companies globally. What makes this pick particularly interesting is that it comes from the technology sector, which has been under significant selling pressure.
As Filip pointed out, some of the best individual stock opportunities can emerge from the weakest sectors, because not every company within a struggling sector deserves to be sold off equally.
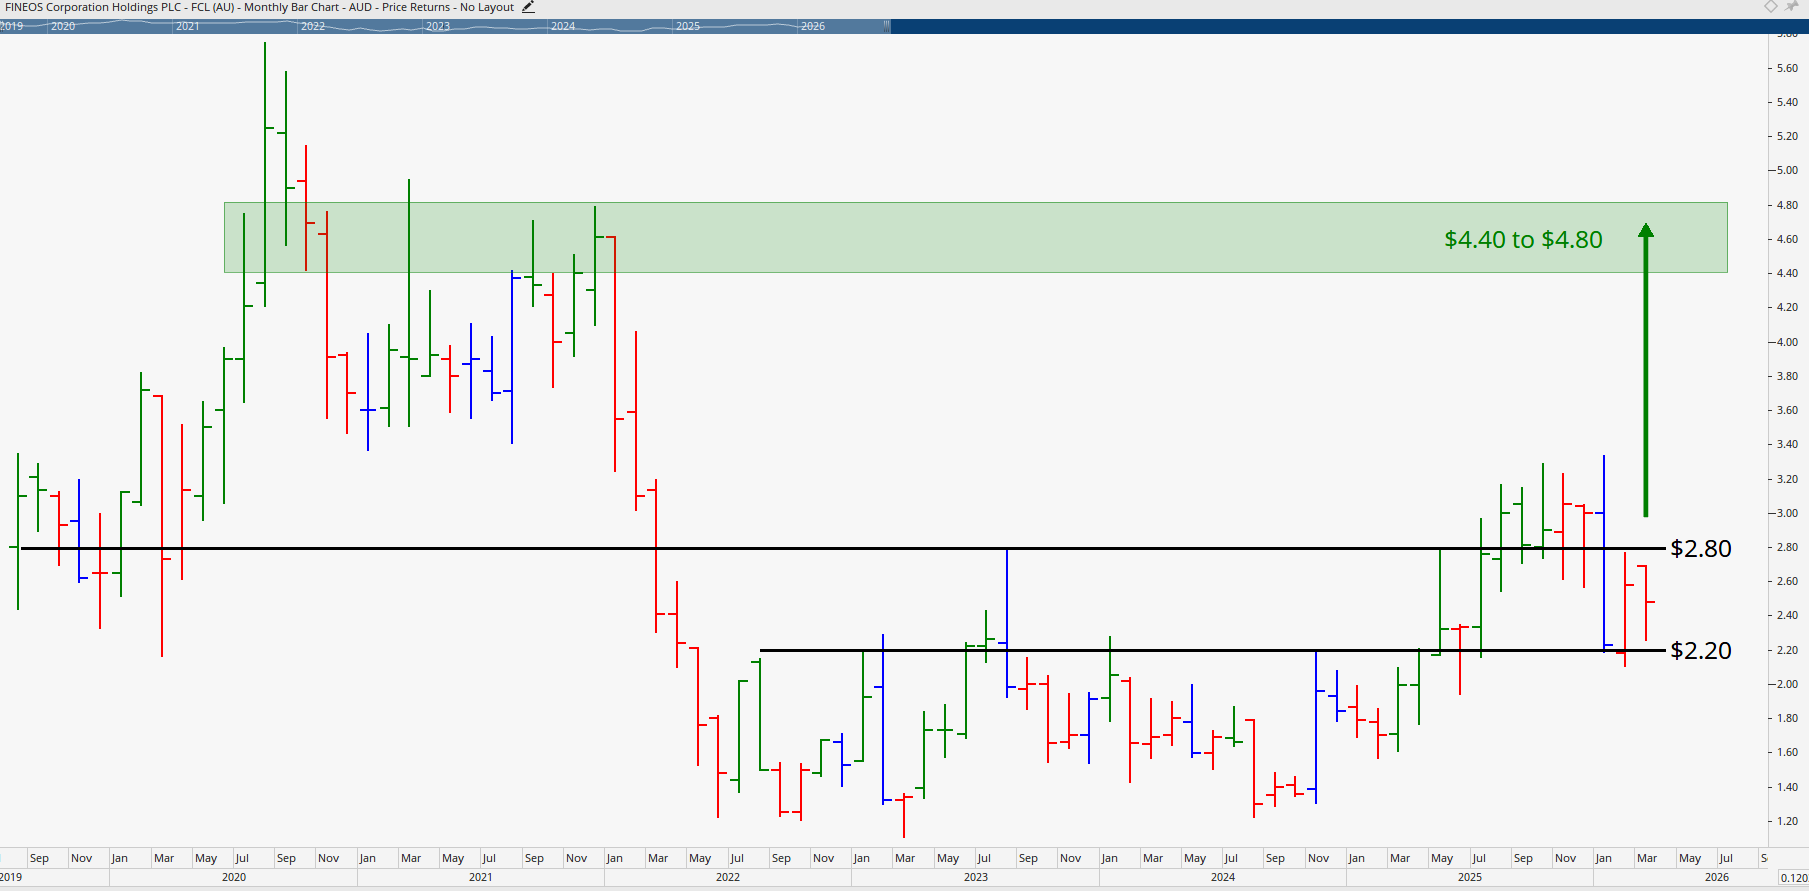
On the monthly chart, Fineos shows a classic post-IPO pattern. The stock had an initial run-up driven by speculation after listing, followed by a sharp correction as reality set in and the market found the true value of the business. What has followed is a prolonged basing pattern, and the stock is now testing its original IPO price around the two dollars eighty level.
This is significant because the IPO price represents the initial valuation the market placed on the company, and a sustained break above it would signal that buyers now accept higher valuations based on the company's actual performance and growth trajectory.
Pedro highlighted that Fineos has high switching costs for its clients, meaning that once insurance companies adopt its platform, they are unlikely to move to a competitor. The company is also investing in artificial intelligence and expanding into the American market, both of which support the fundamental growth story. Technically, the key level to watch on the weekly chart is around $2.20, which has acted as a ceiling for much of the stock's recent history but is now beginning to function as a floor.
If the stock can hold above this level and push through the three dollars thirty resistance, the upside target sits around $4.40 to $4.80, which would represent roughly a doubling from current prices.
The weekly chart does show more volatile and choppy price action, which is typical for less liquid stocks in the early stages of a potential trend reversal. For traders who prefer cleaner signals, sticking to the monthly timeframe may offer a better perspective, while more experienced traders comfortable with volatility may find opportunities on the weekly chart for more precise entries and exits.
If you already have a foundation in chart analysis and want to take your skills to the next level with techniques like time analysis and Elliott Wave, the Advanced stock trading course builds directly on the Diploma and teaches these more sophisticated methods.
The Power of Chart Analysis in Finding Hidden Opportunities
A recurring theme throughout the episode was the importance of chart analysis in identifying these kinds of opportunities before they become obvious to everyone else. All three stocks share a common setup, which was a prolonged period of base building or accumulation followed by early signs of a breakout into a new uptrend. Recognising these patterns requires skill, and more importantly, it requires knowing what to do once you spot them.
Filip and Pedro also stressed the importance of understanding opportunity cost. Sitting in a stock that is going nowhere for years while the rest of the market moves higher is not just frustrating; it is expensive. The capital tied up in an underperforming stock could be deployed elsewhere, generating returns.
Charts give you the ability to time your entries so that you are participating in stocks when they are moving, not when they are dormant. This is one of the core principles taught across all of Wealth Within's trading courses, where the focus is on developing a structured, repeatable process for consistently profitable trading.
What to Watch Going Forward
For each of these three stocks, the analysts provided clear levels to determine whether the bullish setups play out or caution is warranted. Capral needs to hold above the $10.50 support zone. Antipa Minerals needs to break above 75 cents to trigger a potential move toward $1.80. Fineos Corporation needs to sustain above$2.20 and ideally push through $3.30 to confirm the breakout.
These are not buy recommendations but rather analytical frameworks that demonstrate how professional traders assess risk and reward before committing capital. To watch the full analysis with live charts and commentary, you can find this episode and hundreds more in our ASX video library.
Take the Next Step With Wealth Within
These three stocks illustrate a powerful lesson that applies to every stage of your trading journey: the best opportunities are often found where others are not looking, but only if you have the skills to recognise them. Whether you are just starting out or you have been trading for years and want to sharpen your edge, developing a structured approach to reading the market is what separates consistently profitable traders from those who rely on tips and guesswork.
At Wealth Within, our team of investment professionals with over 80 years of combined experience has helped more than 30,000 clients learn to trade shares with confidence. From the Short Course through to the full Diploma and beyond, every course is designed to give you the practical, proven strategies you need to trade profitably in any market condition. If you are ready to stop guessing and start trading with certainty, get in touch today to learn more about how we can help you take control of your financial future.