Markets About to Boom That Big Money Is Buying: Get in Early
By Janine Cox and Fil Tortevski
Major markets have just seen their strongest buying activity in months, and the big question on every investor's mind is whether these sectors have begun their next serious boom. While the world is obsessed with the surface-level AI headlines, the real action is happening underneath, in three specific markets that institutional investors are quietly loading up on.
In the latest episode of the Australian Stock Market Show, Wealth Within's Filip Tortevski was joined by senior analyst Janine Cox and Blueberry Markets' Zoran Kresovic to unpack Bitcoin's structural shift, silver's supply crunch, AI's parabolic run, and the specific ASX stocks positioned to benefit.
Market 1: Bitcoin and the Institutional Inflow Story
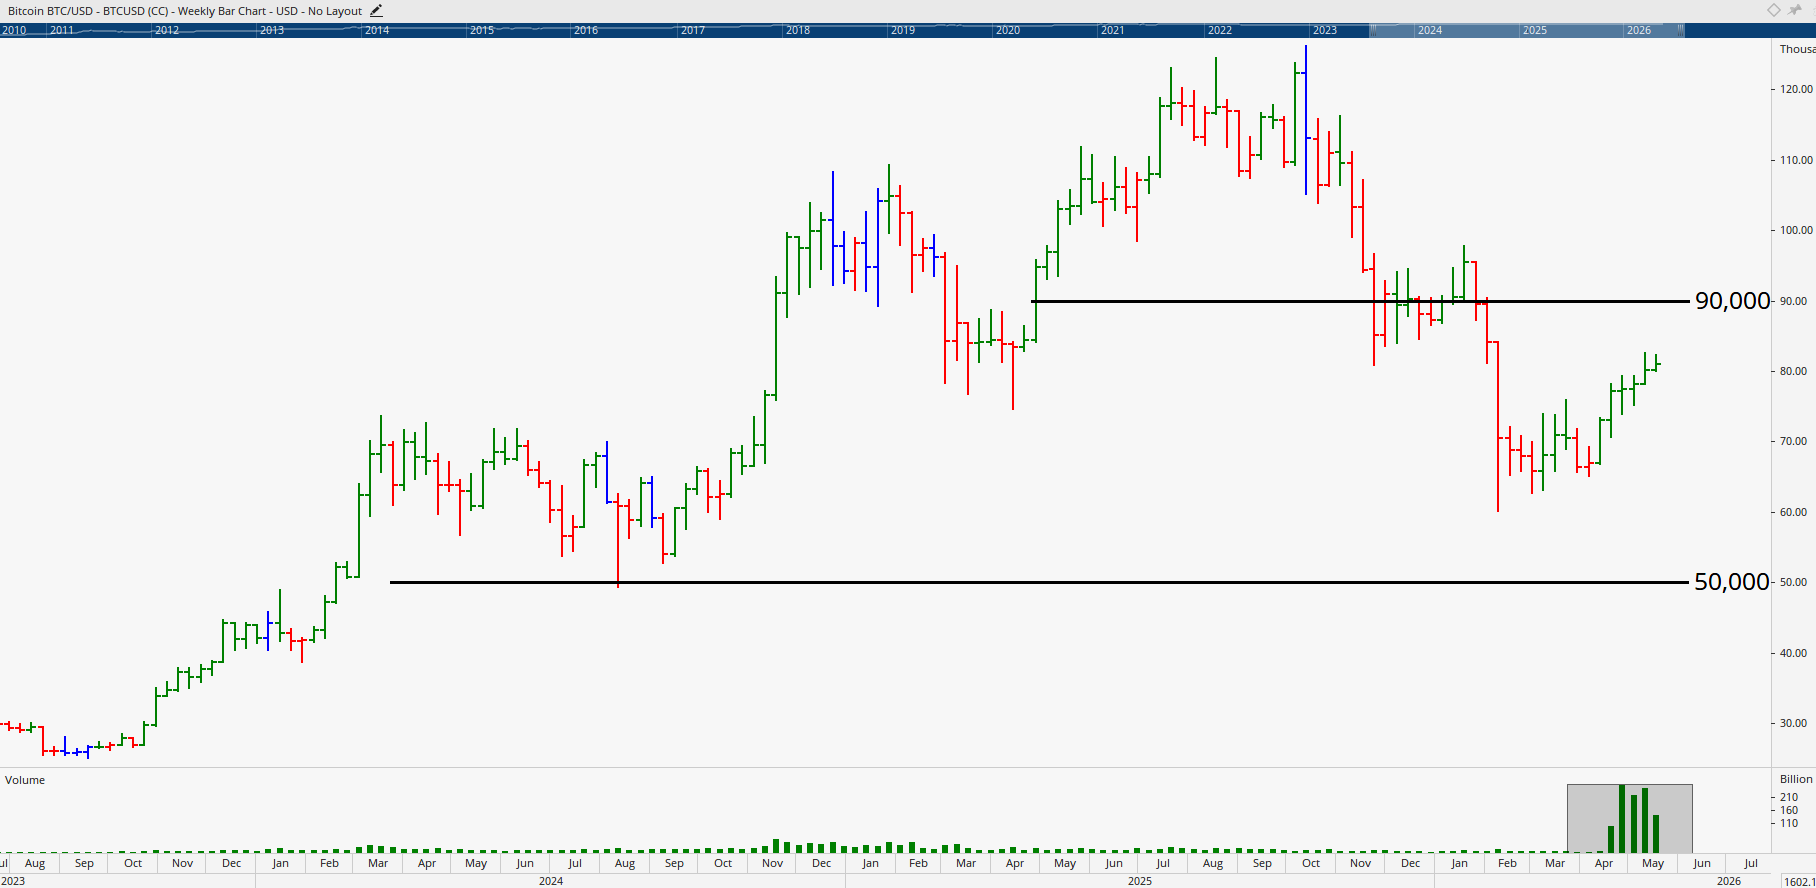
Bitcoin is finally showing signs of life again after one of its sharpest corrections in recent memory. Historically, Bitcoin tends to correct 70 to 80% before bottoming out. This most recent cycle, after topping in October 2025, fell roughly 58 to 60%, which is actually less severe than the 2017 and 2021/22 drawdowns. For the first time since October 2025, spot ETF inflows have turned strongly positive, with both institutional and retail money flooding back in.
The Levels That Matter
The weekly volume profile is unlike anything Bitcoin has seen previously, suggesting heavy accumulation at current levels. For the bull case to confirm, Bitcoin needs to break cleanly above $85,000 and then $90,000, which opens the door to the psychologically critical $100,000 mark. If it fails at $90,000 though, a move back toward the $40,000 to $50,000 region is very much in play.
As Janine noted, this is a case of sitting on the fence with a slight bullish lean. A similar setup in 2022 fooled many into thinking the bottom was in, only for Bitcoin to reverse and continue lower. The $90,000 level is the line in the sand.
Market 2: Silver and the AI Commodity Story
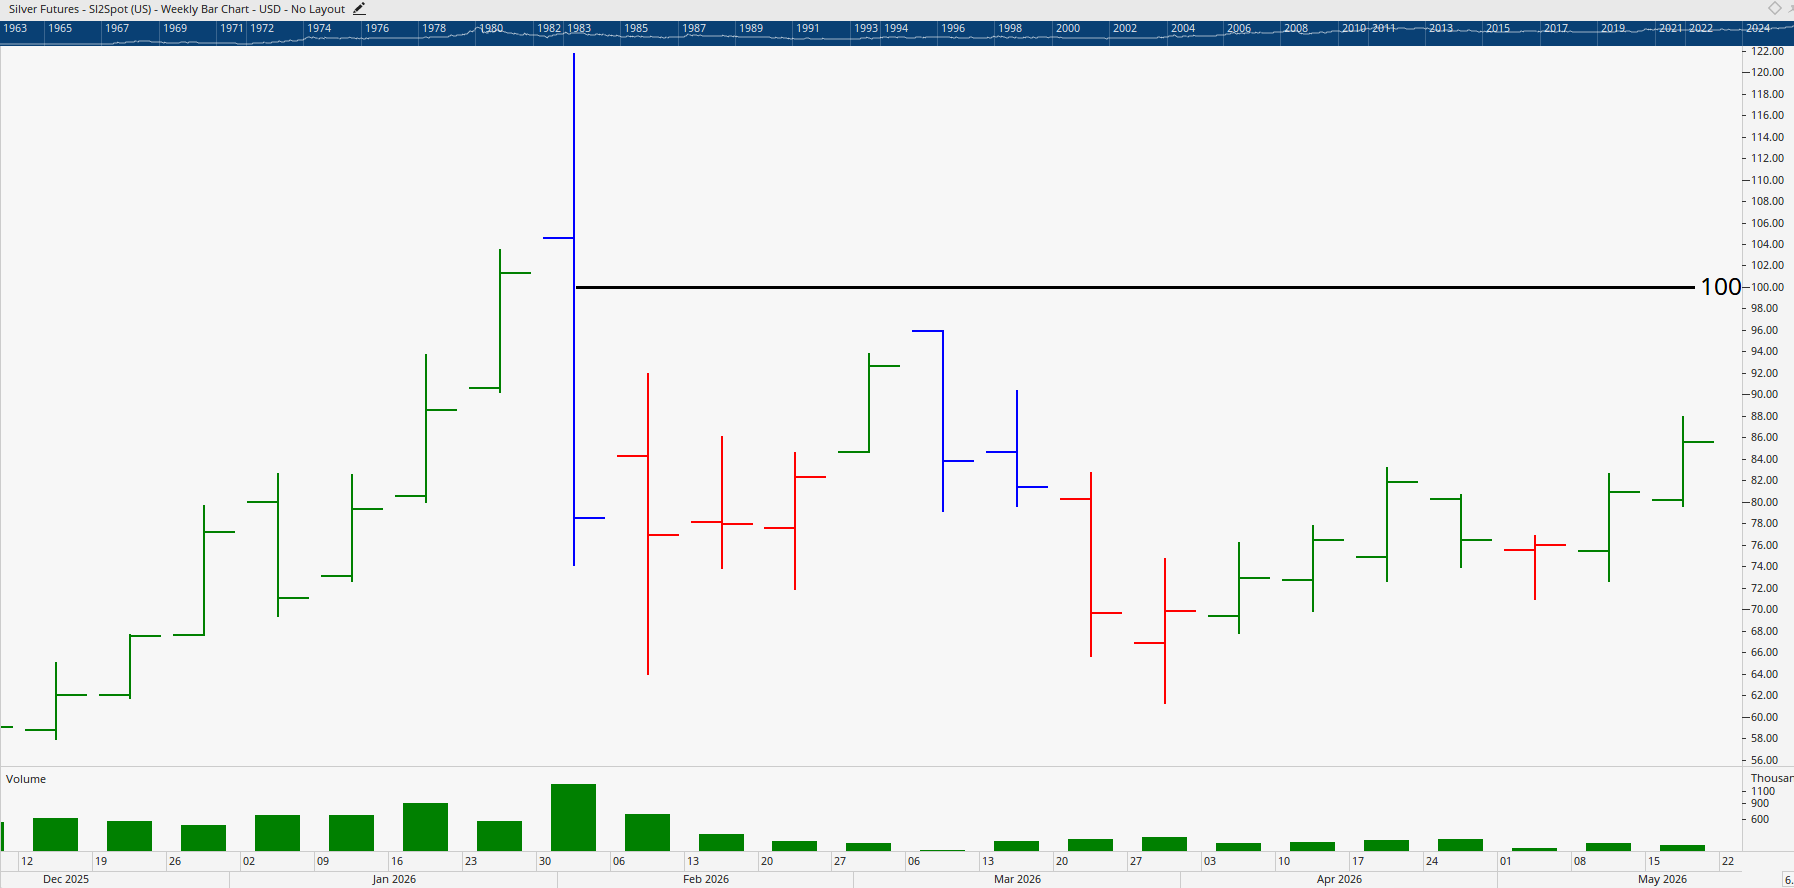
Silver is quietly experiencing one of the largest supply deficits in years, and it's structurally tied to the AI buildout in ways most retail investors don't appreciate. It broke a multi-year downtrend in 2025 and went absolutely parabolic, before settling into the current consolidation.
Why Institutional Money is Rotating into Silver
Three forces are converging. Gold has been a star performer alongside NASDAQ AI stocks, reaching around $5,000, so smart money is looking for the next relative value play. Silver, being much cheaper in nominal terms, offers a much larger percentage upside. AI infrastructure requires silver across countless components, and ongoing geopolitical tensions in the Middle East are adding to the case. Silver is used heavily in infrastructure, building, and industrial applications.
Right now, the chart has formed a higher low and is closing strongly. If that holds, short-term traders could see a move back toward and through $100 per ounce in the near term.
Market 3: AI and the "Is This Dotcom 2.0?" Question
AI infrastructure spending is exploding globally, and the numbers are eye-watering. The Philadelphia Semiconductor Index (SOX) has surged around 70% since 31 March alone. NASDAQ earnings have come in significantly better than expected, with around 80% of US companies beating forecasts.
However, there's a crucial caveat. Only around seven mega-cap stocks are truly driving NASDAQ and S&P 500 returns. The rest of the market is lagging well behind the headline numbers. That's a classic late-cycle pattern, similar to what happened before the GFC, where positive earnings masked underlying weakness until things finally turned.
Janine's view is that the next major pullback deserves extremely close attention. Volatility through the second half of the year is likely to increase significantly, and traders who aren't paying attention could easily get blindsided.
Trending Topic: The CSL Collapse
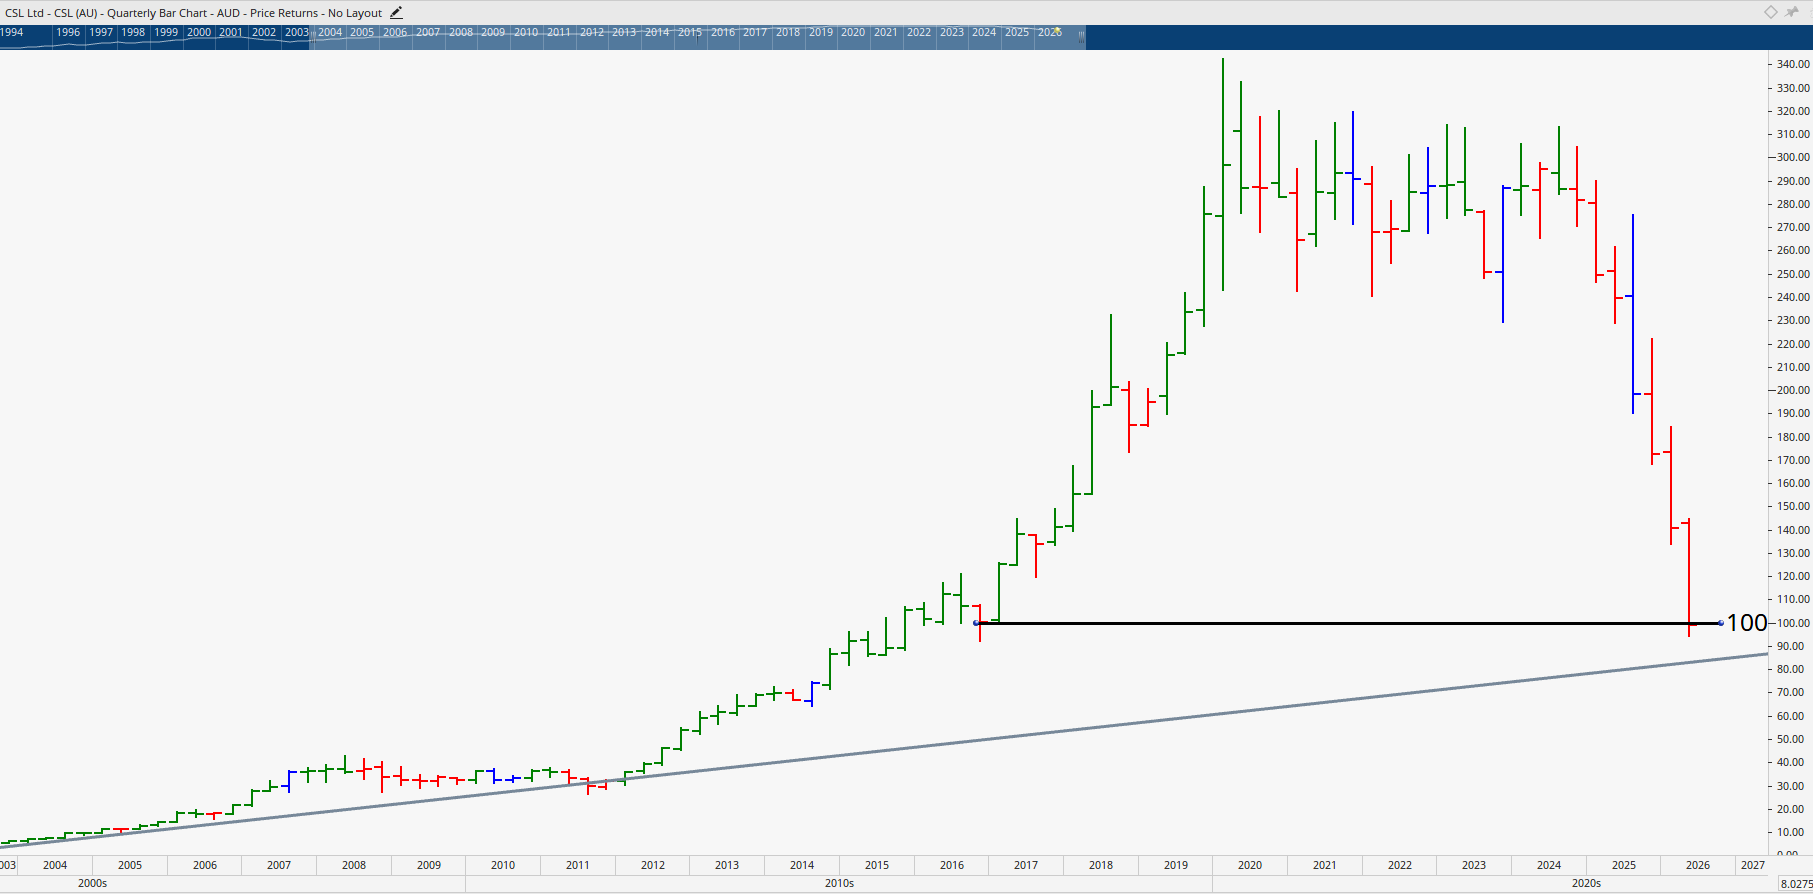
CSL's stunning 20% collapse this week sent shudders through the Australian market, taking the stock to levels not seen since 2015. Once Australia's largest stock by market cap (back in March 2020), CSL has become a textbook example of why "buy and hold" can be catastrophically expensive without proper risk management.
As Stockhead put it brilliantly, the fall has been "the financial equivalent of watching your reliable Toyota Camry suddenly lose a wheel on the freeway."
The $100 Level and What It Means
The stock gapped down on the announcement and is now testing the $100 region. This could be where it bottoms, but history shows these kinds of flush-outs don't always produce immediate reversals. Investors who tried to "buy cheap" at $200 are now staring at losses of 50 to 60%. One trader mentioned in the show was down over 60% on his CSL position after buying it thinking it was a bargain.
The lesson is simple and brutal. You might be looking at the greatest company in the world, but if you buy at the wrong time, the story goes out the window. This is exactly why Wealth Within's government-accredited share trading education places so much emphasis on technical confirmation over fundamental storytelling, through courses like the Short Course in Share Trading and the comprehensive Diploma of Share Trading and Investment.
Even if you'd bought near the top and simply used a stop loss under the previous swing low, your loss would have been roughly 14 to 15%, freeing up cash to buy back in at much cheaper levels. Instead, buy-and-hold investors are sitting on massive paper losses with years of recovery time ahead.
The AI Stock Picks
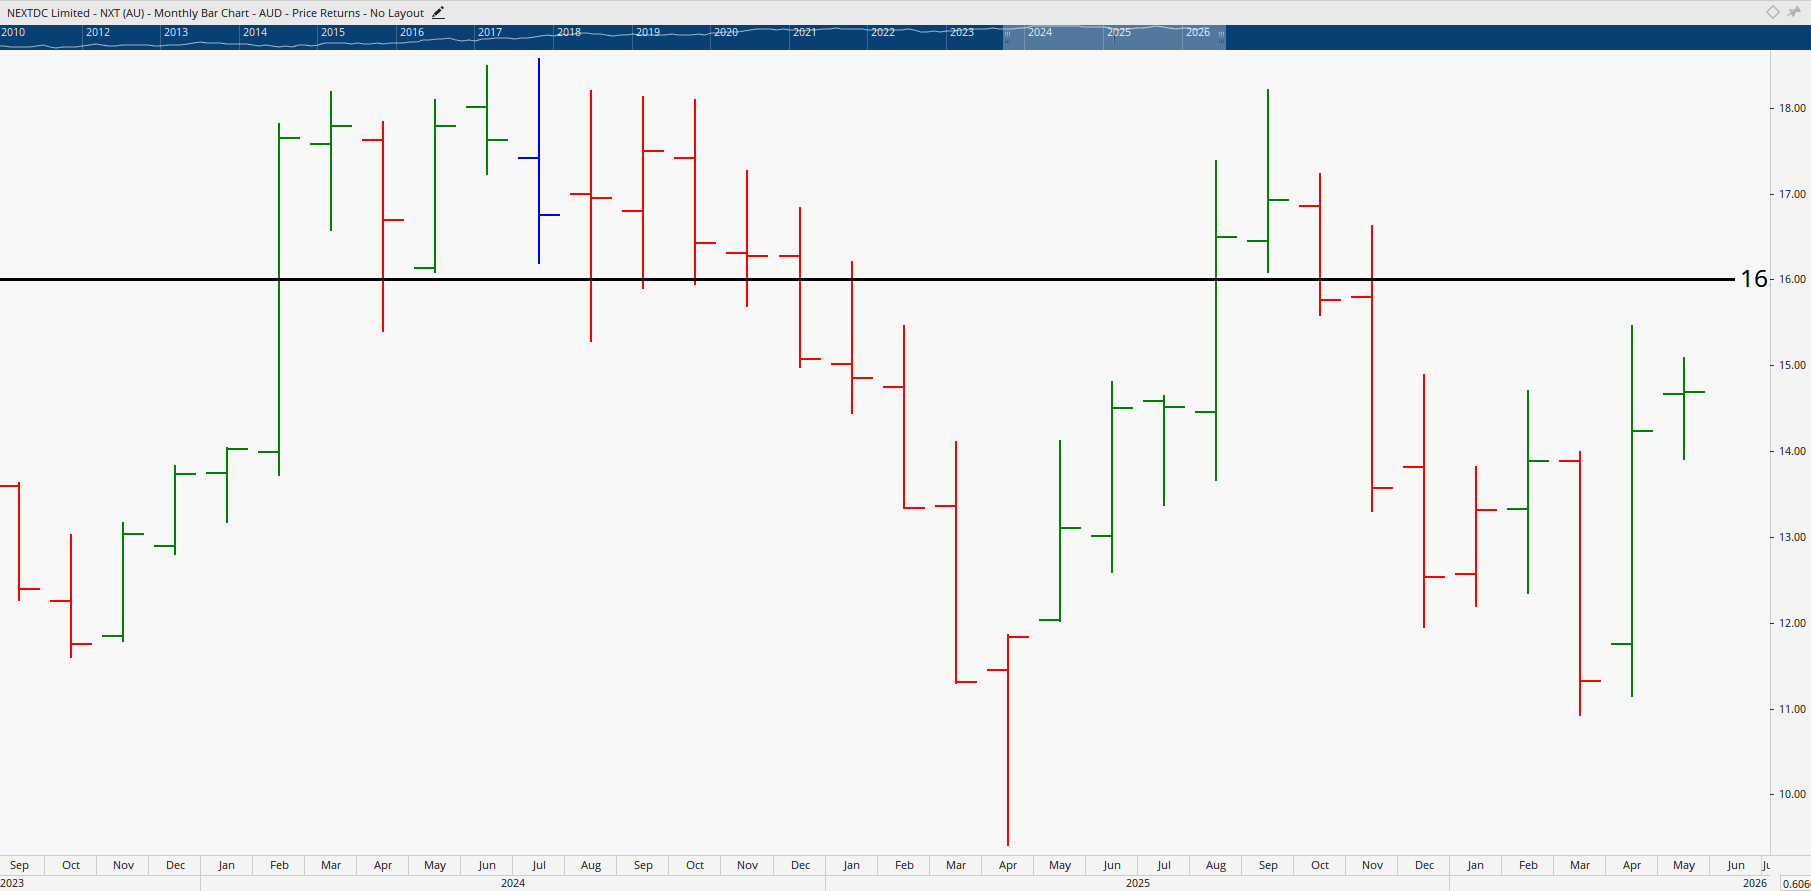
NextDC (ASX: NXT)
An AI data centre infrastructure play benefiting directly from GPU and cloud demand. The monthly chart shows resistance overhead that needs to clear, but the weekly chart shows strong conviction with buyers in control. The gap has closed, a higher high and higher low structure is forming, and a break above $15.99 opens the door to a test of $18. This one has style, and backtesting would likely reveal two or three strategies that work well on it.
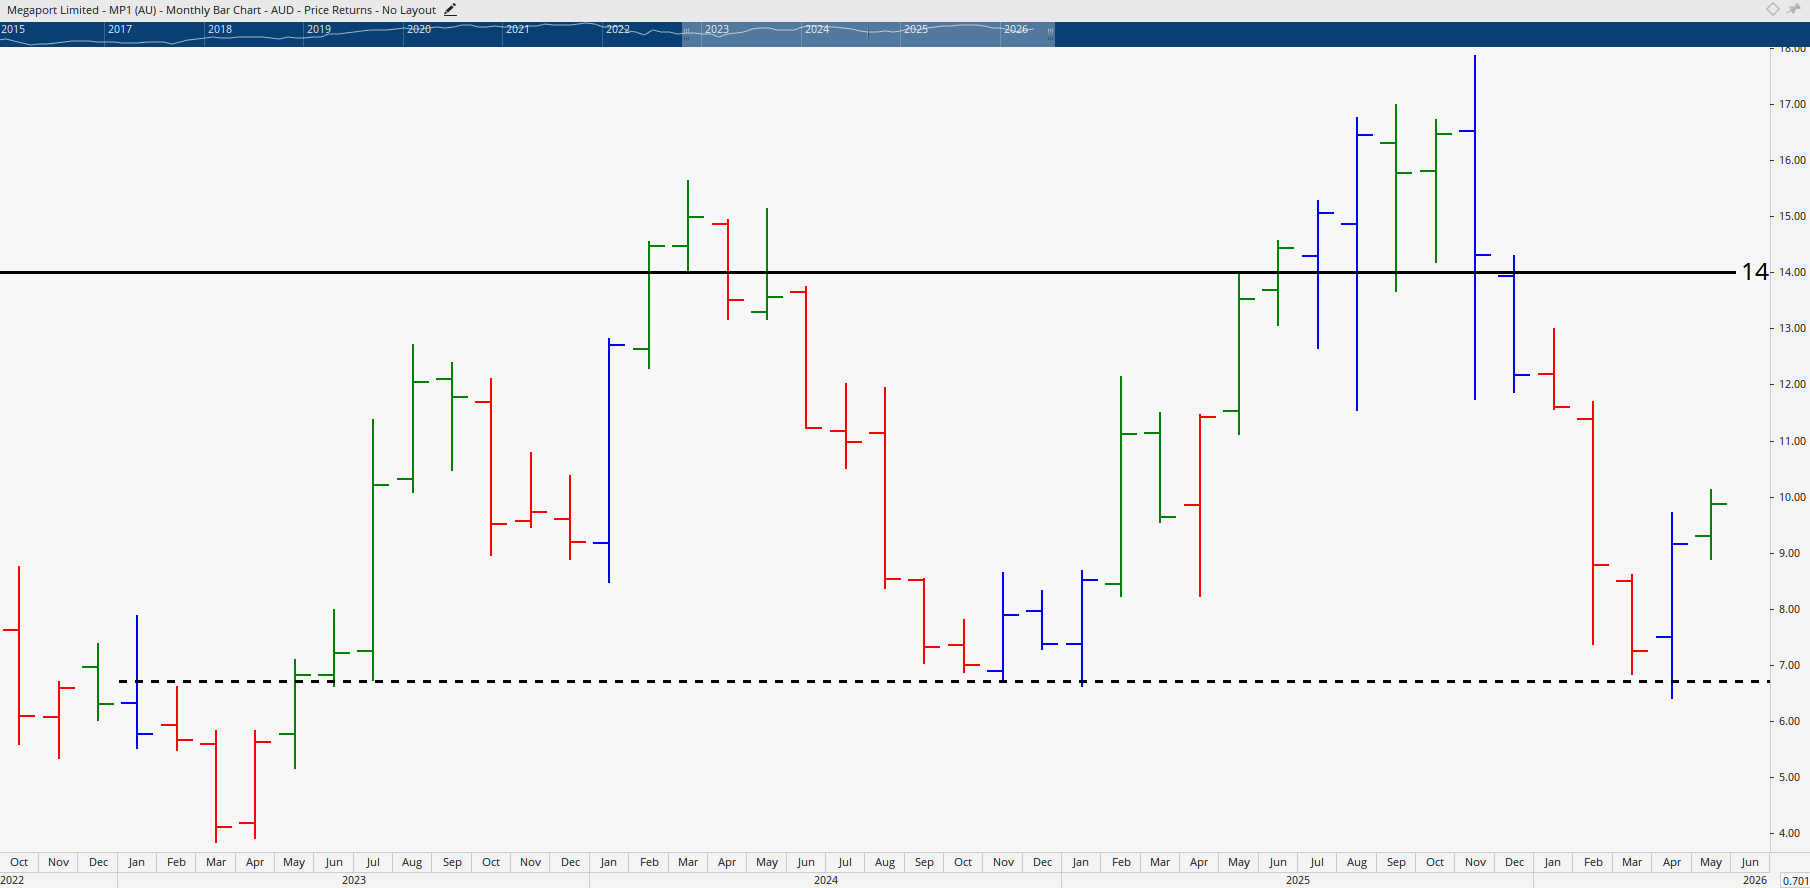
Megaport Limited (ASX: MP1)
Cloud connectivity infrastructure benefiting from AI traffic growth. Currently trading around $10 with strong support at that level. However, it's a volatile, yo-yo style stock better suited to short-term trading than buy-and-hold. A pullback and proper test of support would offer the best entry for a move back to $12 to $14.
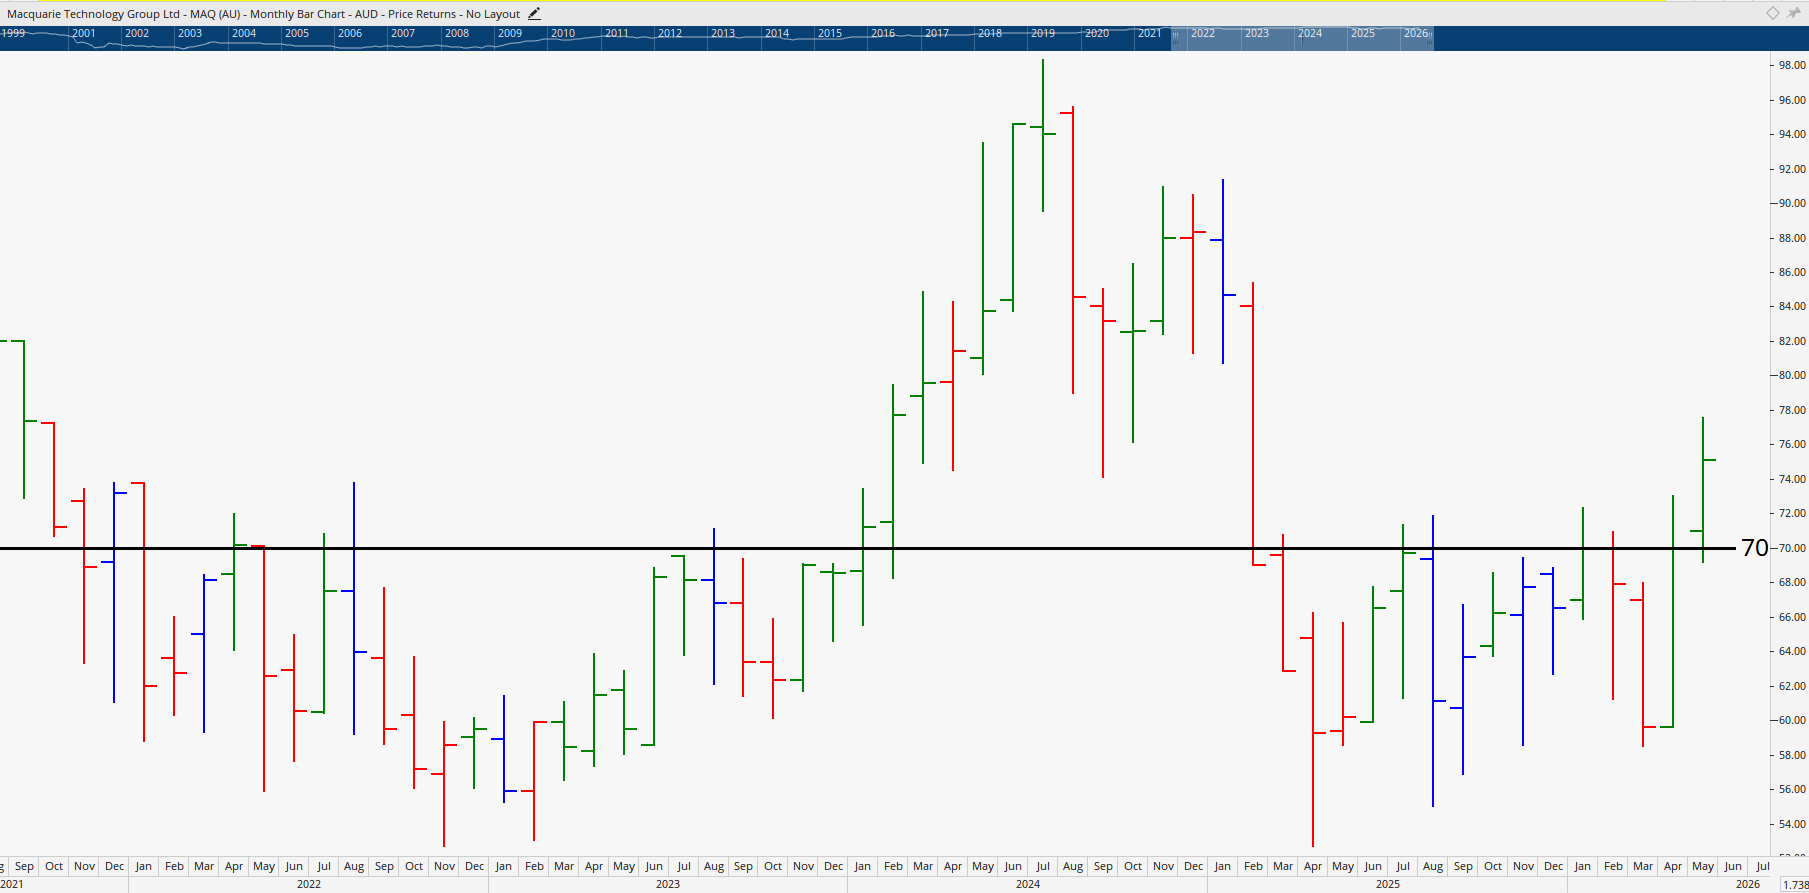
Macquarie Technology (ASX: MAQ)
An AI data centre and cloud infrastructure provider benefiting from rising enterprise AI compute demand and sovereign Australian cloud growth. This one is breaking out of long consolidation, with 30% upside potential on the weekly chart. Volume needs to build on the next push higher, but the setup is clean. A pullback to $70 to $73 would offer an even better entry.
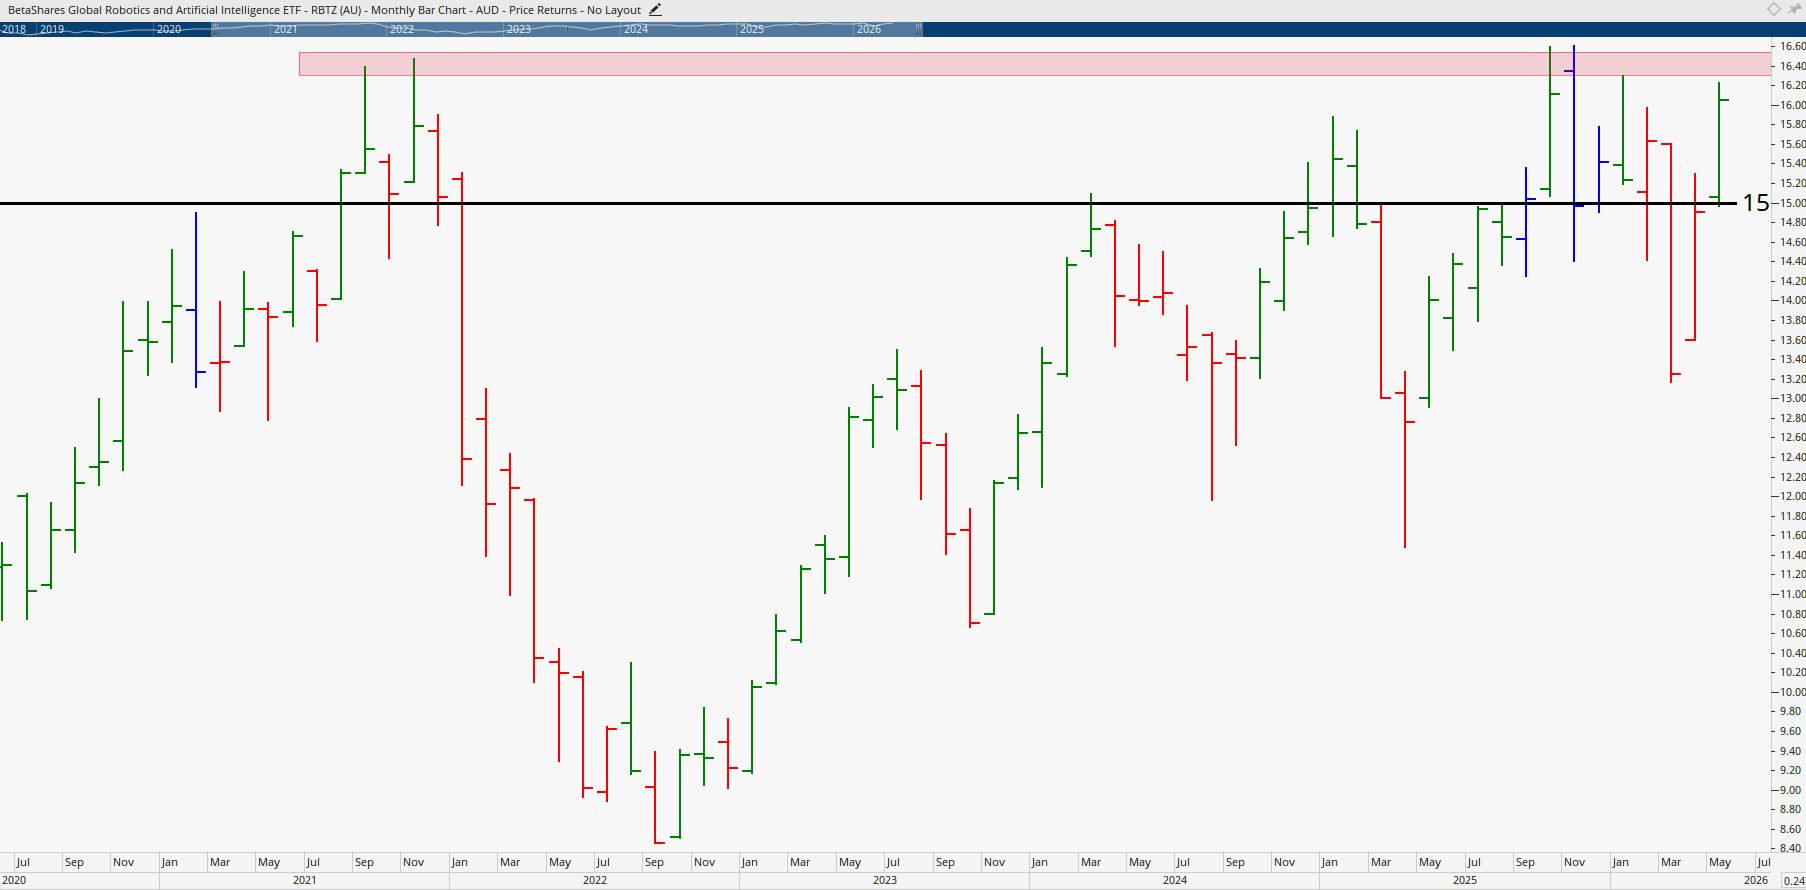
Global Robotics and AI ETF (ASX: RBTZ)
A broader AI and robotics play for ETF investors. Currently challenging previous highs after a strong 22% run over six or seven weekly bars. A clear break above the all-time high is needed before projecting significant further upside, with major resistance levels dating back to November 2021. A pullback and test of $15 would offer the ideal entry.
The Silver Stock Picks
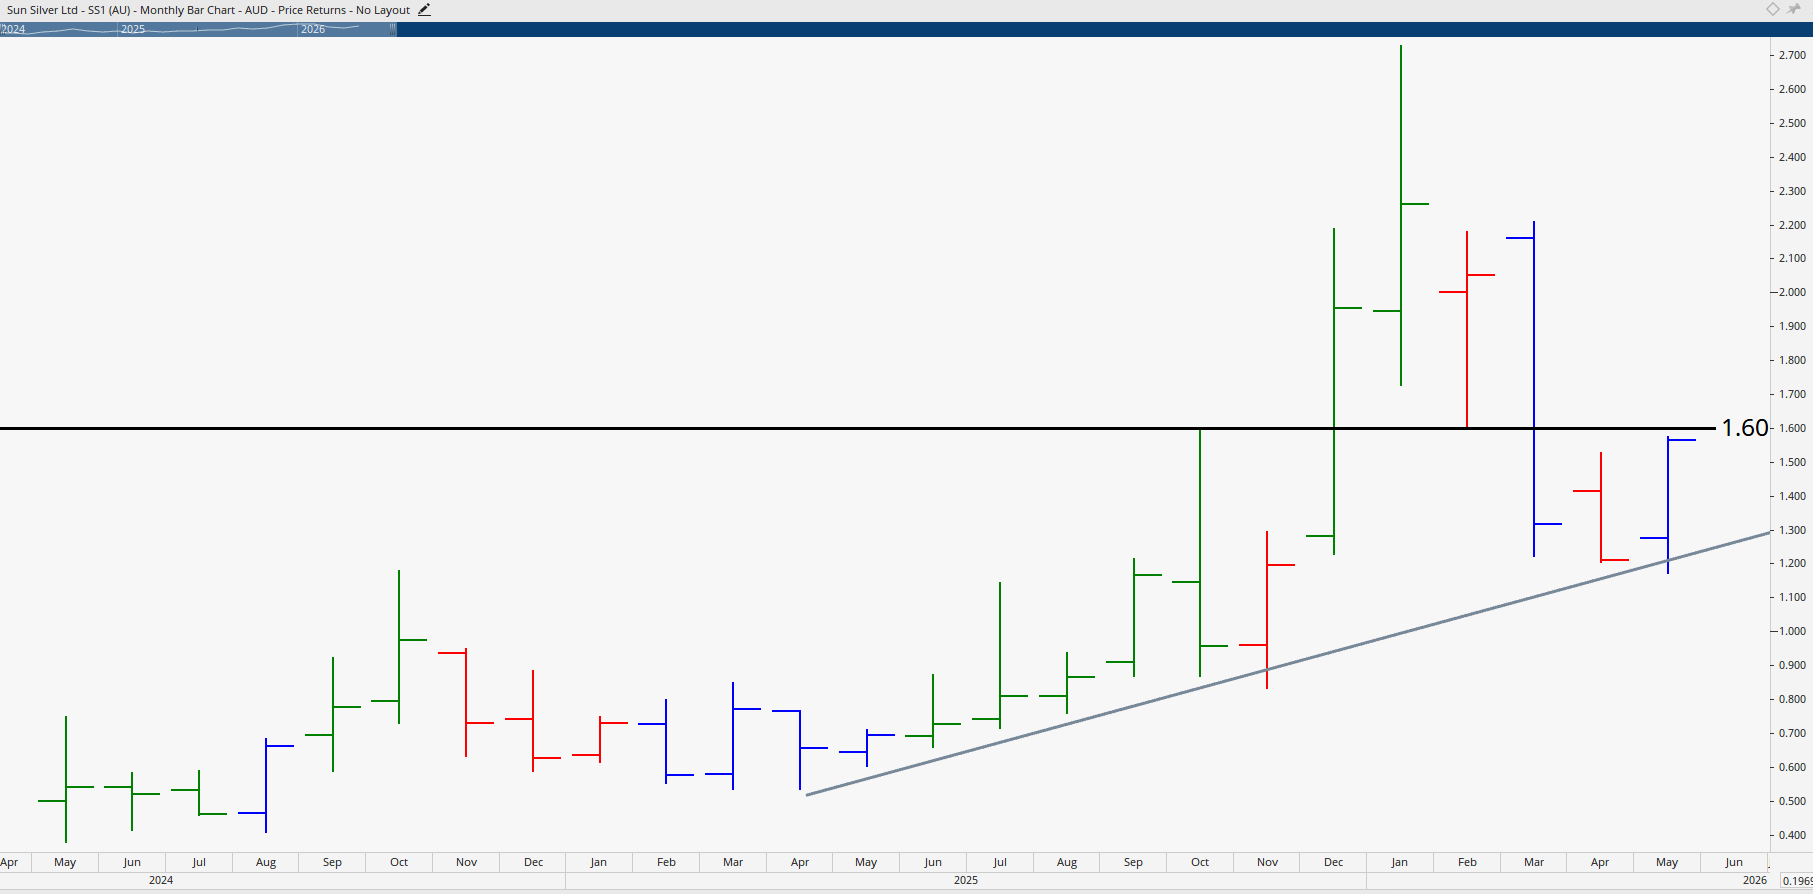
Sun Silver Limited (ASX: SS1)
Operating the Maverick Springs Silver Gold project in Nevada, Sun Silver has pulled back cleanly to a long-term trend angle and is consolidating. A breakout above $1.60 would signal the next major leg higher, with 40% plus upside potential. This one mirrors the silver price chart closely, which is a strong supportive signal.
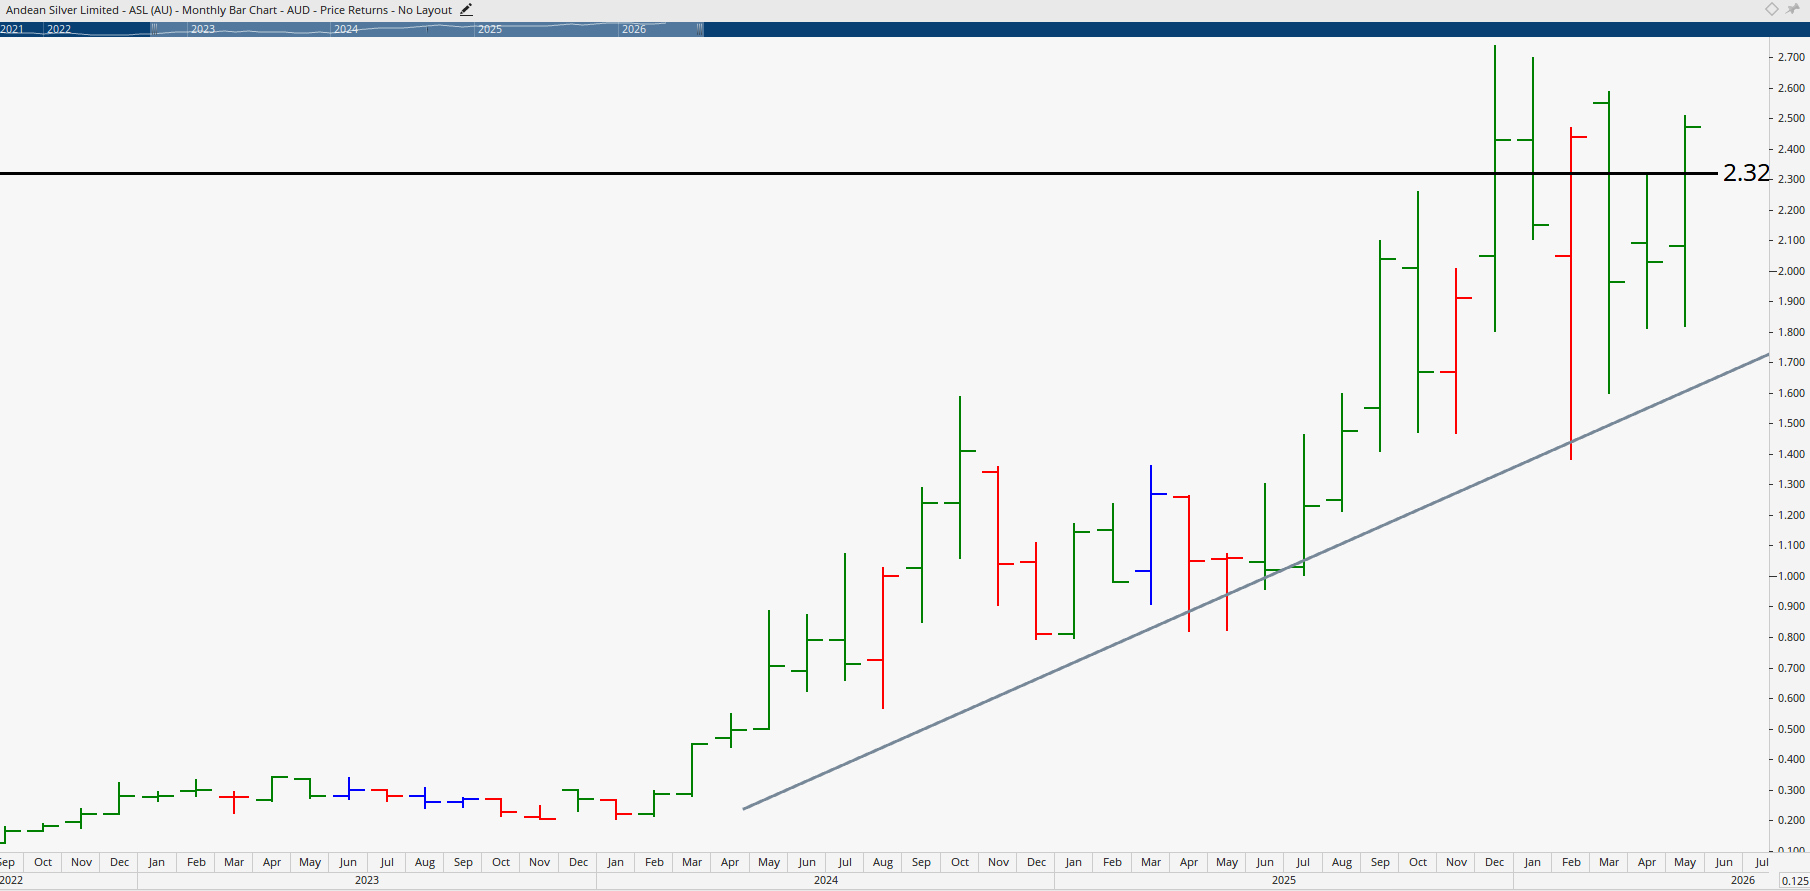
Andean Silver Limited (ASX: ASL)
Holding very high grade silver deposits, Andean Silver is respecting a long-term rising trend angle. The key level is $2.32. Once that high is taken out, the stock should move up through the all-time high. Upside is around 18% from current levels, but the stop-loss logic makes the risk-reward tighter than Sun Silver. Patience is key here. Let it consolidate and prove itself before committing.
Should You Trade the Commodity or the Stock?
One of the most common questions from traders is whether to trade stocks based on their underlying commodity price. The panel's consistent answer is this: analyse the stock first, then cross-check with the commodity as a supporting factor.
Every silver company has different production costs, hedging contracts, jurisdictions, and operational realities. Silver at $80 affects one miner very differently to another. The stock chart tells you the market's collective judgement on all of those factors in a single price, which is precisely why technical analysis is so powerful.
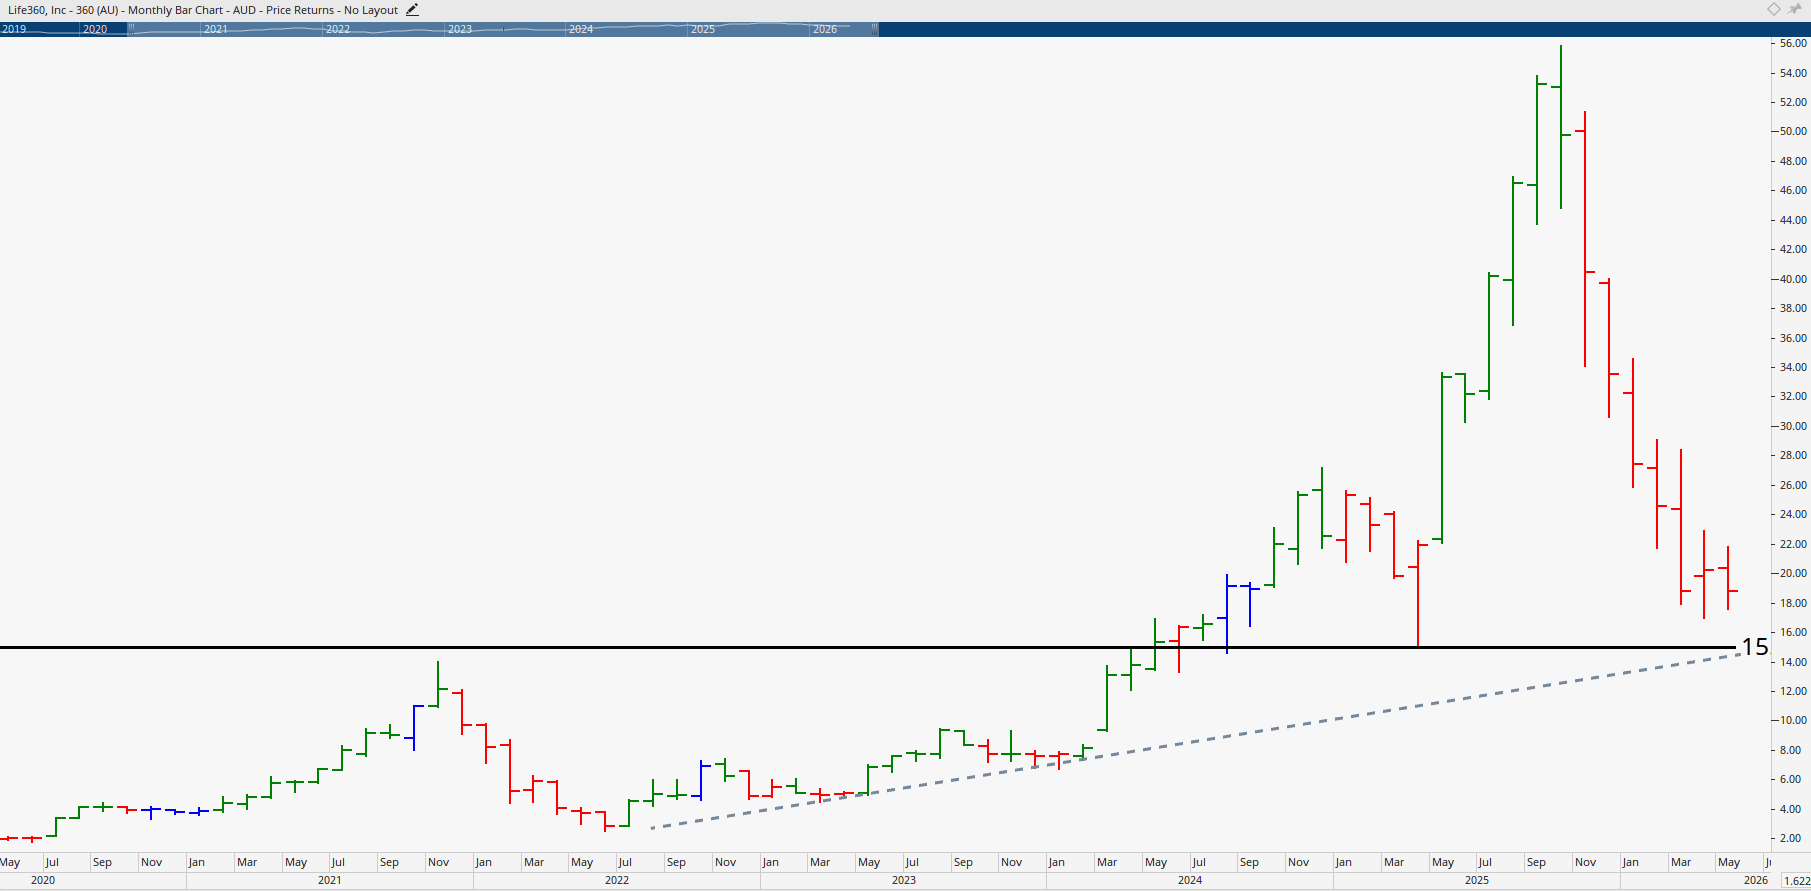
Hot Stock of the Week: Life360 (ASX: 360)
Life360 delivered record quarterly results with revenue surging 38% to $143 million and advertising revenue exploding 329% as its new ad platform gained serious traction. The company upgraded full-year guidance and now has nearly 98 million monthly active users globally.
However, the chart is telling a different story. Monthly, the stock is down 67% from its highs, a classic case of a parabolic move unwinding. A long-term trend line suggests support may come in around $15.
The weekly chart is showing early signs of consolidation. If the stock takes out the recent $22.05 high with volume support, a short-term trade setting up a 32 to 33% upside move to around $29, against a 15% downside risk, becomes viable. However, if Life360 breaks below $16.90 and then below $15, the stock likely has much more downside to come.
This is a prime example of why positive fundamentals don't always translate into positive price action, and why traders need to respect what the chart is actually telling them. For more analysis like this, check out Wealth Within's full ASX video library featuring weekly Hot Stock Tips and market breakdowns, or explore the Advanced stock trading course designed for graduates who want to take their trading to professional levels. You can also learn more about Wealth Within and our 24 plus year history of delivering trusted, government-accredited trading education.
Final Thoughts
Three markets are flashing serious institutional buying signals right now. Bitcoin has seen unusual volume concentration, silver has broken a multi-year downtrend and is consolidating strongly, and AI infrastructure spending continues to drive genuine revenue growth across multiple companies. Whether any or all of these become sustained bull runs or fail at their respective resistance levels depends on what happens next at those critical technical levels.
The traders who profit from these setups aren't the ones guessing or chasing headlines. They're the ones waiting for confirmation, sizing positions properly, respecting stop losses, and knowing exactly what invalidates their trade before they ever enter. That's the difference between treating markets like a casino and treating them like a business, and it's exactly what proper trading education is designed to teach.
Disclaimer: This article is general in nature and does not constitute personal financial advice. Always conduct your own research or consult a licensed adviser before making investment decisions.