Swing Trading Strategies that Deliver Results

By Dale Gillham
When trading the stock market, the most important priority for traders is to enter or exit a trade at the earliest possible time and at the lowest possible risk. This means buying a stock when it indicates with the highest probability that it will move up in a continued uptrend or selling when it indicates it will fall away in a continued downtrend. While this is great in theory, how do you put this into practice? Incorporating swing trading strategies can significantly improve your results and give you the greatest advantage.
Do you find you continually get stopped out of trades, or do you have a series of low-profitable trades followed by a big loss or a series of small losses and an occasional good profit? Then, let me say that you are placing trades with a lower probability of success.
But don’t worry—you are not alone. In my experience, many traders continually chase profits with little, or in some cases, no regard for what they can lose. As a result, they take higher risks than necessary to achieve their goals. The end result is that, over the longer term, their portfolio either underperforms or they incur an overall loss.
Applying swing trading strategies to increase your probability of success
So how do you increase your probability of success?
You can do many things, including increasing your knowledge of how to trade the stock market profitably, setting money management rules to manage your risk, working on your trading psychology, using a trading plan, and so on. While these areas may seem like common sense, I must admit that I have met hundreds of people who claim to be traders but have little to no understanding of these concepts, particularly when it comes to creating a written trading plan. Yet I cannot fathom how anyone can be a successful trader without a written trading plan, which explains why most traders fail when trading the stock market.
In this article, I will introduce you to a simple technique you can include in your trading plan that takes very little time but significantly increases your probability of success. So what is it? One of my favourite trading tools is the Gann swing chart.
What is a Gann swing chart?
For those unfamiliar with Gann swing charts, they are price-based charts constructed from the price relationship between adjacent bars on a bar chart. The basic theory is that the swing chart swings up in price if the current bar has a higher high than the previous bar or swings down in price if the current bar has a lower low than the previous bar.
An important point to note is that, in general, swing charts have no relevance to time. Instead, they provide a very visual representation of the direction and strength of the market in regard to price. At any one point in time, depending on what the price of a stock is doing, the swing chart will either be pointing up or down.
When trading for profit, a trader needs to know the direction of a stock over the short, medium, and long term. Depending on the timeframe you are trading will determine how you view a swing chart and how you apply your swing trading strategies.
How to apply swing trading strategies
Let’s say you want to trade over the medium term. As you can see below, I have included a weekly bar chart and a weekly and monthly swing chart. Notice on the bar chart that the stock has two bars clearly trading above a downtrend line, which would normally signal an opportunity to buy.
If you look at the weekly swing chart on the very right of the image, you will notice that it is pointing up, which is also consistent with a good buying opportunity. However, if you examine the monthly swing chart in the middle, you will see that it is pointing down, indicating a larger downward price movement.
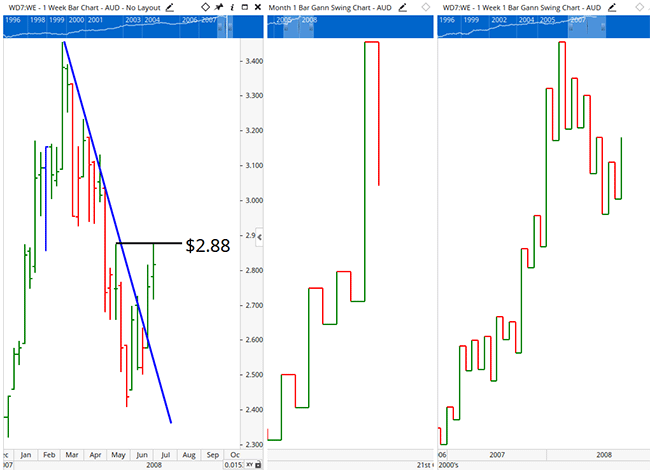
Weekly bar and swing chart Click to see the image in full size
Analysing swing charts
In trading, you need to assume that the short-term trend will always conform to the longer-term trend. Therefore, given that the monthly swing chart is pointing down, you need to assume, with high probability, that the weekly swing chart will conform to the longer-term trend. Until the chart indicates otherwise, you wouldn't enter a trade.
Eventually, when the stock is strong, both the weekly and monthly swing charts will conform, and you will be able to enter the stock knowing with a higher probability that it will continue to move up over the medium term.
In this instance, the price at which both the monthly and weekly swing charts should conform is at $2.88, as indicated by the horizontal line on the bar chart above. This is the point at which the stock will trade higher than its previous high, resulting in the monthly swing chart turning up.
Rules to follow when using swing trading strategies
I'll share with you a number of rules I think you should include in your trading plan when using swing trading strategies.
When trading short term, over several days, the daily and weekly swing charts should point in the direction of the trade you want to take. If you trade Forex, options, or warrants, then unless you are totally proficient in cycle theory, I recommend you rigidly stick to this rule, as it will help you avoid many losses.
If you trade over the medium to longer term, then both the weekly and monthly swing charts must point in the direction you want to trade. Once again, I would not break this rule, as it will greatly increase the risk you are taking.
For some of you, sticking to the above rules will be hard as you may find a stock moves in the direction you want, but the swing chart keeps you out of the trade for a period of time, resulting in you entering at a higher price. While this may be the case at times, you need to have faith in this rule because I promise you that it will save you from entering losing trades and, as a result, increase your overall trading returns.
How swing charts can support you in your trading
Because swing charts only represent a stock's price movement, they filter out the noise commonly associated with bar charts. Therefore, swing charts make it easier to see:
- peaks or troughs,
- support and resistance levels,
- chart patterns, and
- in determining the strength of a stock.
On the weekly swing chart below, I have shown six years of price history. I could have easily included 10 years, and it would still have been very easy to read. I have marked horizontal lines on the chart, indicating both support and resistance levels, as well as where the stock retraced 50 per cent of the last up-range in the most recent uptrend.
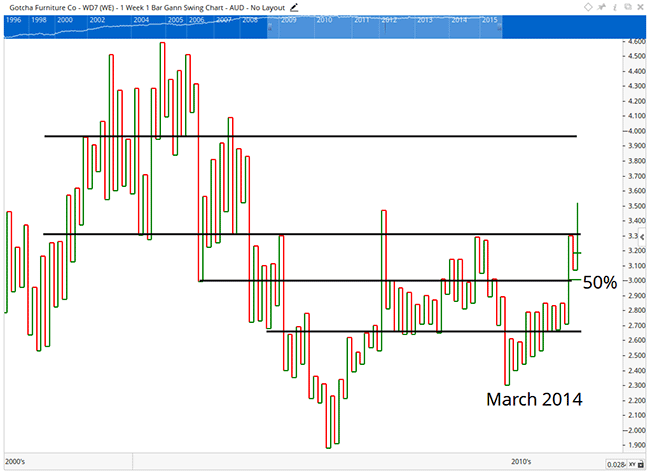
Swing Chart Click to see the image in full size
The uptrend started from the low in March 2014, after which the stock confirmed successively higher swing lows and highs, indicating it was now in a new uptrend. In October 2014, the stock price turned down to test support before rebounding. Given that the stock retraced less than 50 per cent of the last price upswing, it confirmed that the stock was strong. From there, the stock's price moved up to break through a downtrend line, confirming a strong buying signal.
In fact, this is one of the lowest risk trades you can take given that the stock had closed twice above a downtrend line, both the monthly and weekly swing charts were pointing up, the stock had confirmed a higher swing low and high on a weekly swing chart, and it had retraced less than 50 percent. It doesn’t get much better than that.
Analysing stocks using swing charts
So here is a tip for new traders. Every single swing high and swing low on a swing chart can be used to apply a trend line. Therefore, if you are ever in doubt about whether you can draw a valid trend line on a bar chart, simply look at the swing chart to see if there are three swing highs or swing lows that you can connect.
To increase your knowledge in using swing charts, I recommend you look at several stocks and notice how various patterns unfold, including head and shoulders, flags, pennants, double tops and bottoms, and how easy they are to spot. I also recommend you apply various tools to your swing charts, like trend lines, price extensions and retracements, as well as other popular tools to see what happens. If you are like me, you will be amazed at how easy it is to analyse a stock using this type of chart.
Others who read this also enjoyed reading: