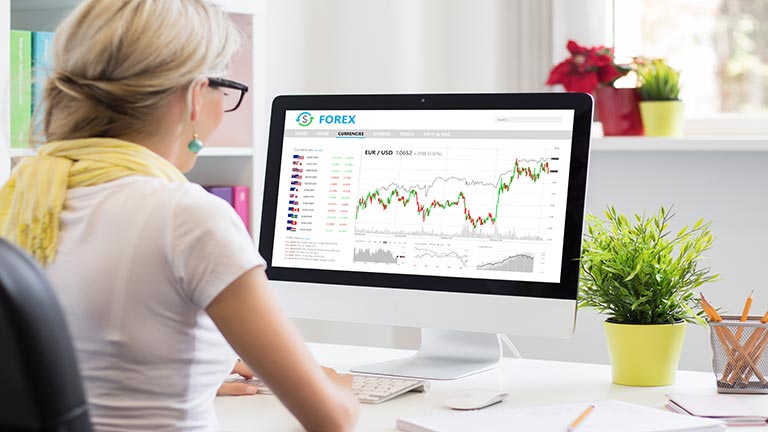
How to Identify and Trade Market Trends
When it comes to trading the stock market, it is not how much money you make on any one investment that makes you wealthy, it is how much you do not lose over time. It is for this reason why it is so important to know how to identify and trade market trends. In fact, if you can correctly ascertain the direction of the trend, you can pinpoint with greater certainty, the right time to buy and sell, which means you will be far more profitable.
Obviously, the higher the return you desire, the more knowledge, experience and time you will need to devote to your investments. This doesn't mean you need to look at the market on a daily basis; rather it simply means you will need to commit some time to monitoring your stocks and managing your portfolio.
Of course, the challenge is to develop a system that is repeatable, so that profitable returns are consistently generated, which is why we will discuss in this article what you need to know to confidently identify and trade market trends.
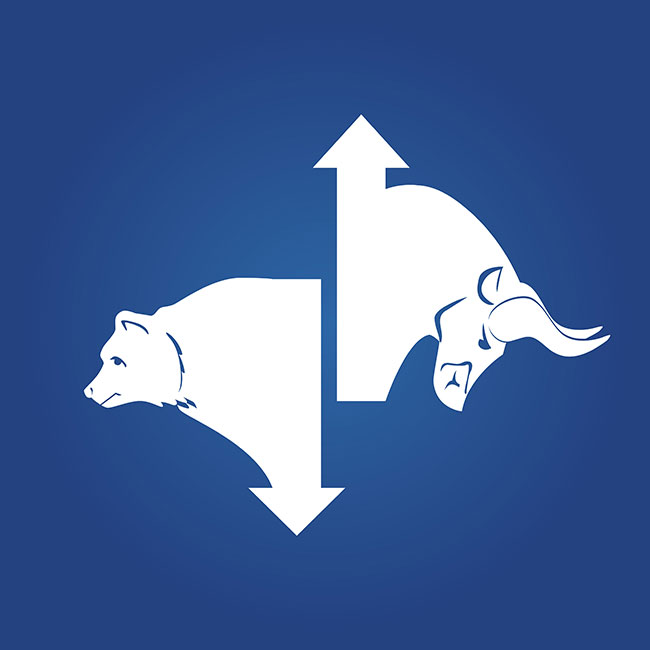
Understanding bull and bear markets
I’m sure many of you have heard the story of the tortoise and the hare. But have you heard the story of the bull and the bear? The terms bull and bear are often used to describe how stock markets move in general. So, what's the difference between the two?
A bull market occurs when the majority of stocks are rising in price while a bear market occurs when the majority of stocks are falling in price. While these terms may seem like odd names to describe market movements, they came about because of the way animals attack their prey.
A bull thrusts its horns upwards, while a bear swipes its paws downwards and these actions are used as metaphors to describe movements in the market. Therefore, if the overall trend is up, it is referred to as a bull market and if the overall trend is down, it is referred to as a bear market.
What actually drives markets to rise or fall?
When chatting to people about the stock market, it becomes apparent that most believe trends or market movements are caused by news or political events. However, it is actually the social mood or the general mood of a society, that determines direction. Would it surprise you to know that much of the news and political events that unfold are already factored into the price of the market? Let me explain.
In simple terms, social mood is about confidence, or how confident we are as a society about our future.
Experts on social mood say that a major market index is to social mood what a barometer is to weather. A barometer measures changes in the air pressure to highlight when we can expect a change in the weather. Imagine what it would mean if you were able to read the market that way!
Social mood is not a study of short-term emotion but, rather, medium to long-term trends in our behaviour. To look at social moods in the short term would be just as futile as looking at the daily price movements on the stock market. Professionals know that daily fluctuations are irrelevant. Unfortunately, many individuals analyse the market this way and, in doing so, miss the bigger picture (or, in other words, the trend), which makes them far less effective.
An example of how social mood works
A great example of how social mood works occurred when the Federal Reserve (or the Fed as they are more commonly known) in the United States announced that it would taper quantitative easing, which is a monetary policy that simultaneously injects liquidity into the economy while reducing interest rates. Initially, the market reacted swiftly to the news with a sell-off, however, the social mood in the US at the time was more optimistic about the future, so the market quickly recovered. This repeated itself each time the Fed met to discuss the policy. Therefore, it is the underlying social confidence of a market that determines direction, not short-term emotions.
The more confident the underlying social mood, the more likely we are to invest. The more pessimistic it is, the more likely we are to sell out of the market. Understanding the collective mood of a society is easier than trying to keep up with the latest in world economics and news events, then trying to understand how this may impact your investments (which is even harder). It also ensures that you are better prepared for the most important moves in the market.
There is a point in any trend when the social mood becomes overly optimistic or overly pessimistic. This occurs around market tops and bottoms, signalling a likely change in trend. Unfortunately, the masses tend to miss these signals and, instead, get caught out buying at the top and selling at the bottom of a market, behaviour prevalent during the global financial crisis. But being aware of the social mood means that you won’t get swept up in the mindset of the herd.
Trading with the trend
No doubt some of you will have heard that trends represent the basic foundation of trading any market. Sayings such as “the trend is your friend” and “always trade with the trend” are common place in books or courses about trading.
Unfortunately, the 90 per cent of individuals who lose money in the markets today do so because they unknowingly break from this basic foundation of trading by trading counter to the trend. However, when trading the stock market, the carved-in-stone rule you must always remember is this: All trends conform to a longer-term, existing trend.
For example, if a stock has been in a long-term bearish downtrend for two years, there is a high probability it will continue to fall; in fact, the probability is as high as 80 to 90 per cent. If after falling for two years, the stock then turns and rises for five weeks, the probability that it is starting a new bullish uptrend is only 10 to 20 per cent.
Unfortunately, at this point in time, many people fall into the trap of believing a new uptrend is unfolding, and they attempt to buy at the bottom for fear of missing out on the potential rise. The cold reality is that, often, the market turns down again, causing the individual to suffer more losses. Acting on this low probability of a potential change in trend is not conducive to good trading.
In short, you should always trade with the trend.
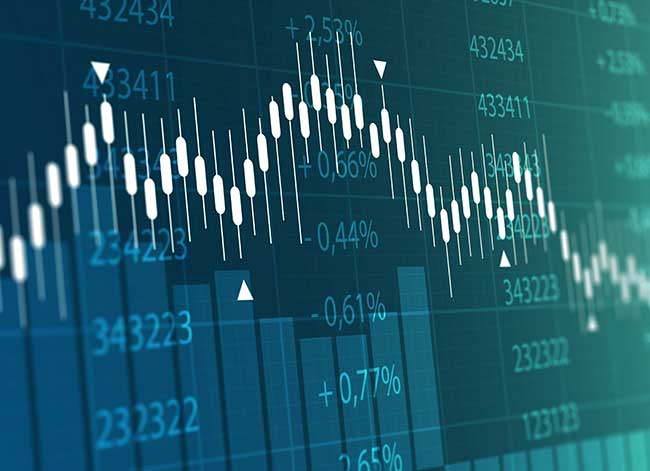
What is a trend and how do you identify trends?
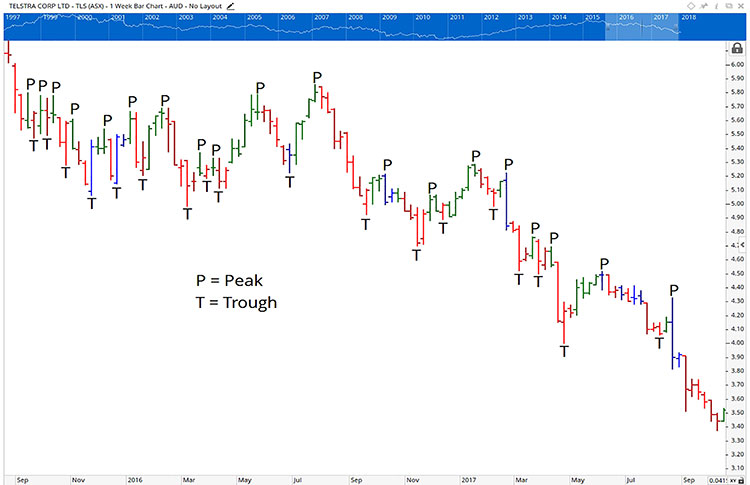
When prices rise for a period of time and then fall away, a crest or peak is formed. On the other hand, when prices fall for a period of time and then rise once again, they form a low, or what is more commonly known as a trough.
Therefore, an uptrend is the result of a rising movement in market prices, which is confirmed by a series of higher peaks and troughs. A rising stock is said to be bullish indicating there are more buyers than sellers.
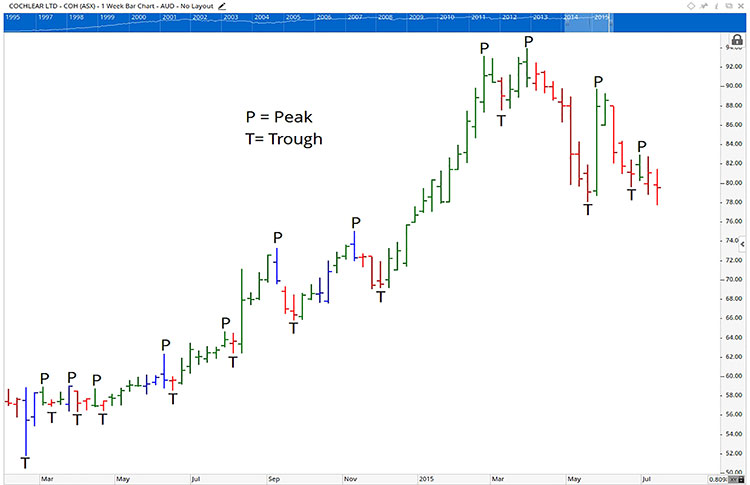
Meanwhile, a downtrend is caused by a falling movement in market prices, and is confirmed by a series of lower peaks and troughs. A falling stock, on the other hand, is said to be bearish, indicating there are more sellers than buyers.
What to consider when trading trends?
A major consideration when investing over the long term is the direction of the trend over the longer term and, to a lesser extent, the medium term. Therefore, you will gauge a lot of what you need to know by analysing the trends of a stock on a monthly chart.
If, however, you are trading over the medium term, the major consideration is the direction of the trend over the medium term and, to a lesser extent, the shorter term. Given this, you will gauge a lot of what you need to know by analysing the trends of a stock on a weekly and monthly chart.
The major consideration when investing over the short term is the direction of the trend over the medium term; therefore, you will gauge a lot of what you need to know by analysing the trends of a stock on a weekly chart.
That said, it still pays to confirm the longer-term trend by reviewing the monthly chart. By doing this, you will be able to gauge the direction, the length and the strength of each trend of lesser degree.
When viewing a chart, you will be able to tell that the price of a stock is rising if it has successively higher bars. On a monthly chart, stocks that rise over three or more consecutive months are said to be in an uptrend while on a weekly chart, this equates to twelve or more bars moving in an uptrend. Obviously, this statement is not flawless, as a stock can rise for three months (or twelve weeks) and then move sideways or down. However, it does provide a starting point from which to analyse the strength of a stock.
Let’s look at some examples.
How to trade trends in the stock market
The monthly chart of Aristocrat Leisure represents the stock as it rose in price from 2003 to early September 2019, where the trend changed from up to down before returning to trade in an uptrend again.
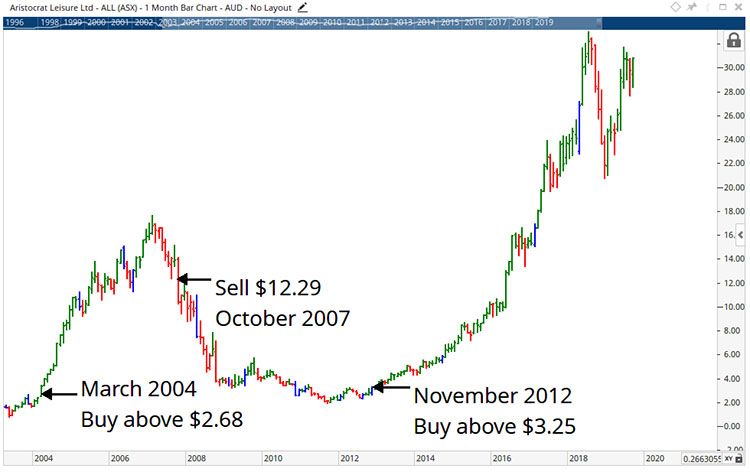
In effect, it represents the consensus of thousands of investors over a period of sixteen consecutive years, as the stock trended up from $0.75 to $17.68 in February 2007, before falling to $2.10 in September 2011 and then rising back up to $33.06 in July 2018. Depending on your confidence level, you might have entered the stock some time late in 2003 after it had been trending up for more than 3 consecutive months.
But even if you had waited until sometime in early 2004, when the price of the stock was approximately $2.70, you would still have made around 360 per cent, excluding dividends, before selling in 2007 at a point where the stock had fallen more than 30 per cent in price, using very conservative entry and exit rules.
Not every stock will give you this sort of profit, but most blue chip companies usually yield around twenty to fifty per cent or more in growth in an uptrend. As you can see on the chart, we placed the next entry in 2012 at $3.25 based on the same rules and, again, the profit is quite impressive at nearly 1,000 percent.
So what is the monthly chart of Westpac telling you? Once again, this is representative of a solid blue chip stock that has trended up nicely between late 1992 and early September 2019 by over 1,500 per cent, excluding dividends.
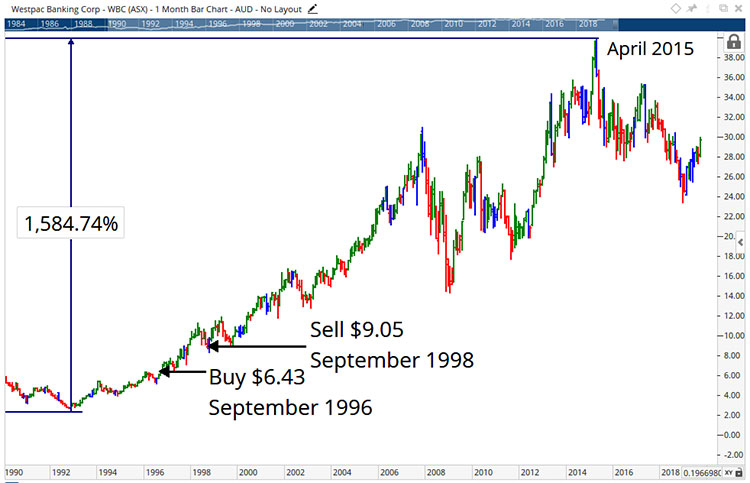
While there have been many opportunities to profit from this stock over the past 25 years, with the stock rising between 20 to 50 per cent or more over a few months to around three years, I have shown one trade using the same simple rules I applied on Aristocrat, with the trade making just over 40 per cent in two years.
Generally, the top 50 stocks by market capitalisation produce very steady uptrends that are easy to identify. Stocks out to the top 150, however, are a little more volatile and, therefore, require more diligence on your part if you choose to invest in them.
As with any stock, there is always an element of risk, but the educated investor can minimise this risk. Remember, you can always sell if you are wrong in your analysis.
If you are serious about your success in stock market and you want to learn how to trade with more confidence and certainty, we’ve got the books and trading courses that will give you knowledge to profitably trade in any market condition. To speak to a member of our team, call 1300 858 272 or Email us and we will be happy to answer any of your questions.
Others who read this also enjoyed reading: