Analysing Stock Market Data

By Janine Cox
In the days before computers became commonplace, newspapers provided the necessary information for people to stay informed about a company’s share price. And despite the advances in technology, some newspapers still allocate sufficient room on a daily basis to report company data.
But if you are like most people, it’s far easier and more convenient to look at stock market data using a computer or your mobile device. So what do you need to understand when analysing stock market data and how can you use it to make decisions about what to buy and sell?
How to analyse stock market data
Let’s take a closer look at exactly what is reported. The Australian Securities Exchange (ASX) is generally the source of all stock market data for listed companies in Australia.
When a company transitions from being a private company to listing on the stock exchange as a public entity, it is given a unique identification code consisting of three letters. Therefore, you can either look up the company by name or the ASX code, if you know it.
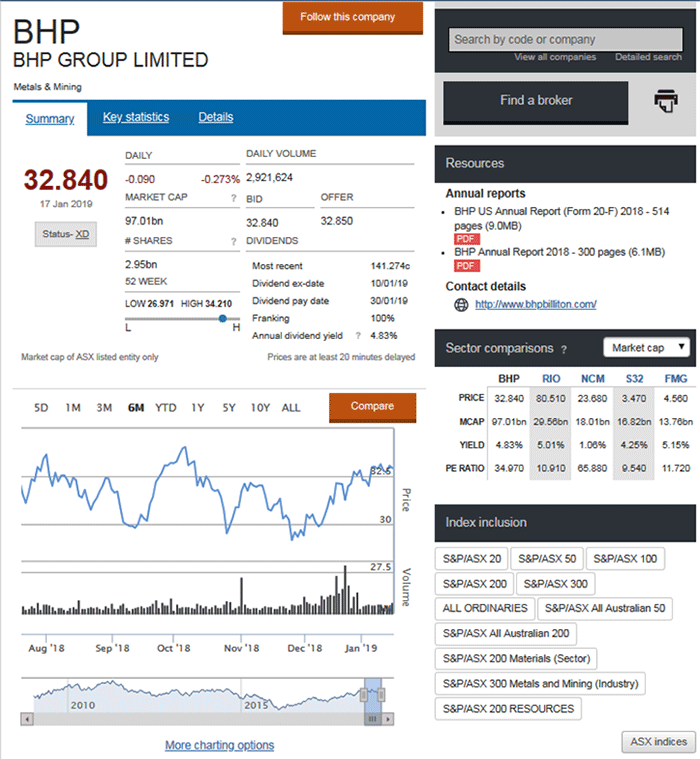
Below is a snap shot from the ASX website of BHP. To find this information, look under Prices and Research and then Company information on the ASX website. In a lot of cases, the letters in the company name are used in the code. For example BHP Group has the code BHP.
As you can see, there is a lot of valuable information included, but how do you analyse all of this data and how can you use it to your advantage. Before we delve into this in more detail, you will notice on the right hand side of the screen shot on BHP, below, that the ASX includes the following information about each company:
- The annual reports issued by the company (under the Resources sub-heading);
- A comparison of other companies in the same sector, which for BHP is the Metals and Mining Sector; and
- A list of all Indices on the ASX that includes BHP.
Now let’s consider each piece of information and what it represents.
Analysing price based stock market data
In the financial industry it is often said that the uneducated open the market and the educated, or those in control, close it. Therefore, the previous close or the last price quoted for a stock each day, which in this instance is $32.84 (the price in red on the left of the screen) is probably the most useful if you are looking at the data in isolation, as it provides the value of the shares on a particular day.
If you were to record the closing price of a stock over a number of days, you could determine whether it was moving up or down over the short term. While I encourage you to do this, it is important to understand that you shouldn’t focus on the short term price action when analysing a stock. This is because it can be an emotional roller coaster ride, particularly without the right knowledge, and it is certainly not something you would use on its own when making investment decisions.
Most successful investors actually focus on the medium to longer term direction of a stock and trade with it, as this increases the probability of a profitable outcome. The stock market data provided by the ASX enables you to make some sense of the medium term direction by quoting the highest price and lowest price for the past 52 weeks, which as you can see above is $34.21 for the high and $26.97 for the low.
If you look at the stock chart on the Summary Tab above, you will also be able to understand how the stock has moved over a longer period of time as the ASX allows you to view the data as far back as 10 years.
The Summary Tab also includes:
- The bid ($32.84) and offer ($32.85) price or the buy/sell quote, which are the prices the buyers and sellers were willing to pay when the stock last traded, and
- The total number of shares the company has on offer, which in this case is 2.95bn.
Understanding market capitalisation and volume
Some additional information that is also valuable includes the market capitalisation of the company, which for BHP is currently 97.01bn shares. To calculate the market capitalisation of a company, you simply multiply the total number of shares on issue by the current market price.
Market capitalisation is used to work out the value of a company listed on an exchange. This information can also indicate whether the price action of a stock is likely to be more volatile than another company. That’s because the lower the market capitalisation, the more volatile the stock is likely to be and the more challenging it is to trade.
Another piece of information that is useful is the volume of shares traded for the day. This assists in determining the liquidity of a stock or the ease with which you can buy and sell a stock. The volume of shares traded is determined by multiplying the closing price with the volume of shares traded. To get a more accurate picture of volume, it is important to understand how the volume traded changes over many weeks.
Bear in mind, depending on the stock and market activity these figures can vary considerably from day to day. As a general rule, you can buy and sell shares without the price getting away from you too quickly if you invest in companies with a minimum volume of 1,000,000 units and $3,000,000 traded per week. Obviously the higher the liquidity the less this becomes an issue.
The most useful piece of information, besides the stock code, the closing price and the 52 week range, is the annual dividend yield, which is the income you can generate by holding the stock as a percentage of the share price.
Analysing fundamental stock market data
Generally, blue chip companies pay shareholders close to or above the market average dividend, which is currently around 4 per cent of the company’s share price. If you look at BHPs dividend yield (in the screen shot below), you can see it is currently paying above market average at 4.83 per cent.
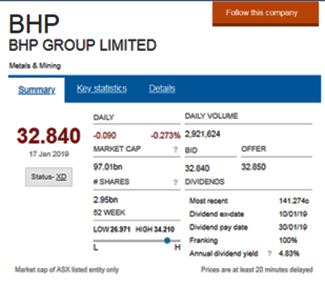
The dividend yield is calculated based on the last dividend paid divided by the current price of the shares and, therefore, changes as the share price rises and falls.
You will also notice on the Summary Tab additional information related to the dividend including:
- The ex-dividend date: If you purchased shares before the ex-dividend date, you will receive the dividend;
- The dividend pay date, which is the date you will receive the dividend; and
- The franking credit, which is the percentage of tax the company has paid on its profits.
A franking credit is a type of tax credit that allows Australian companies to pass on tax paid to shareholders. Franking credits reduce the income tax paid on dividends, or depending on your income tax level you may be entitled to receive a full tax refund for the franking amount.
More fundamental information about the company is also included on the Key Statistics Tab, as shown below.
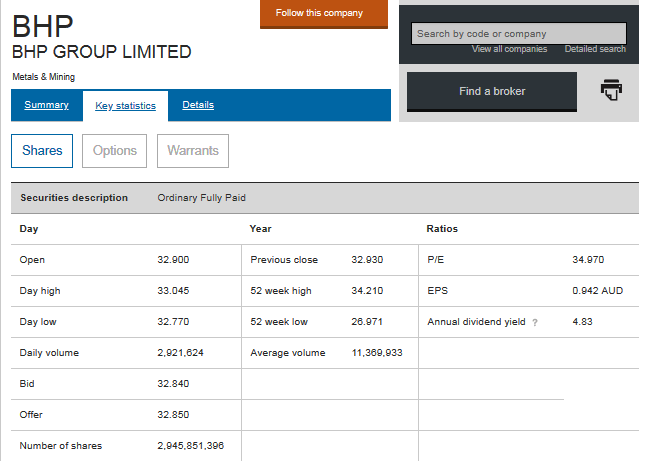
The price earnings (PE) ratio and the earnings per shares (EPS) ratio (on the right of the screen) are valuable pieces of information. The PE ratio is an historical value that indicates how fast a company’s earnings are expected to grow. A low PE compared to other stocks in the sector suggests that the stock is undervalued and a good buy. While a high PE ratio indicates that the stock is overvalued and should be sold.
The EPS, on the other hand, indicates the profitability of a company. Therefore, if the EPS is rising this suggests the company is well managed, which is why is it important to look at the projected or forecast EPS, which you can find on your online broker’s website or Morningstar’s website.
Analysing the previous days close
The Key Statistics Tab also includes the open ($32.90), high ($33.045) and low ($32.770) price for the day as well as the previous day’s close ($32.93). Remember, as I mentioned previously, you could record the closing price over a number of days to determine whether the stock is moving up or down over the short term.
In this instance, if we compare the closing price for the previous day ($32.93) to the closing price of today ($32.84), you will note that the share price is moving down. This is also reflected in the daily price movement on the Summary Tab, expressed in dollars (-0.90) and cents, as well as a percentage (0.273%).
Using stock market data to select stocks
While it is important to be able to analyse stock market data, it is by no means a tool to assist you in selecting stocks to invest your hard earned money. At some point, you need to take your interest from scratching at the surface to a whole new level so you gain the knowledge and skill to safely and confident trade the market. This is because you need to know how to manage risk, as well as how to profit from investing in the stock market. It's also important to understand the golden rules to investing in shares. Together with this information and the knowledge that Dale Gillham outlines in his latest award winning book, Accelerate Your Wealth - It's Your Money, Your Choice, you will be armed with the know-how to invest in the stock market with more confidence.
Others who read this article also enjoyed reading: