How to Increase the Odds of a Winning Trade

By Dale Gillham
It goes without saying that there is an inherent level of risk involved in trading the share market. To be consistently profitable, however, you need to assess whether the risk you are contemplating is worth taking.
But how do you assess this risk and how do you increase the odds of a winning trade so that they are stacked in your favour? In this article, I will outline how you can increase your chances of accomplishing a winning trade and reduce the risks of losing.
A winning trade is about learning how to stack the odds in your favour

Many traders often ask: “when I have two stocks giving me a buy signal, which is the best one to buy?” However, what they’re really asking is which stock will make the most amount of profit.
But as you would have heard me say many times before, trading is not about how much money you can make, it is about how much you do not lose. So, I always respond to the question by asking: “which stock will give you the least amount of risk if you decide to trade it?”
In other words, trading it is about learning how to stack the odds in your favour by reducing risk and increasing your probability of a winning trade.
Obviously, the higher the percentage the stock has of giving you a winning trade, the more the odds are stacked in your favour. Personally, I do not trade unless I can achieve around a 70 per cent chance or better of having a winning trade.
To give you an example as to how I achieve this, I will use a trade on Oil Search that I have previously recommended to give you insights into my methodology. The process I share with you is just as relevant today as it was then. At the end of the article, we will review where the stock is currently trading and how it is likely to unfold in the future.
Techniques for increasing the odds of a winning trade
Oil Search (OSH) caught my attention because it had been trending down from a high of $4.48 in August 1997 to a low of $0.57 in December 2002 before finally finding support and rising once again. Although the stock was cheap, buying OSH at that point would have been high risk.
So how do you reduce your risk and stack the odds of a winning trade in your favour. This is where I assess the big picture on a monthly chart to determine the personality of the stock because I want to know if the stock will be easy to trade.
Chart 1, below, is a monthly chart of OSH and as you can see, the stock has trended up and down for periods of three or more years. Given this, if I get the direction of the trend right, I can predict that trading the stock would be easy. In fact, even if I miss the entry signal by a few weeks, it will make very little difference to the overall profitability of the trade and more importantly, the downside risk will be quite low.
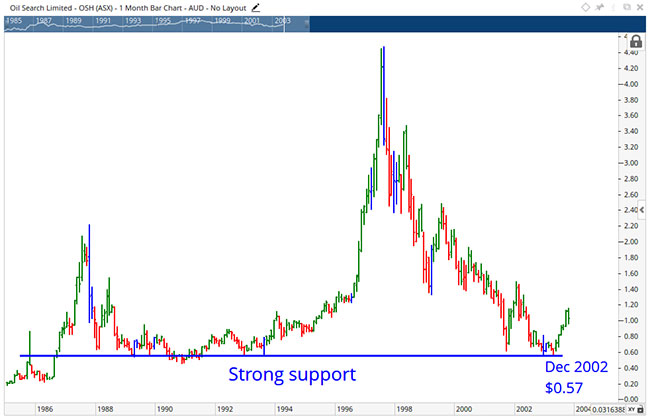
Chart 1
I have marked the low of $0.57 in December 2002 on Chart 1, above, as this was a significant support level for the stock given that it was only $0.01 higher than the lows in January and August 1993 with further support provided by a low in April 1989.
Extremely bearish stocks will quite often find support around previous major lows before they begin to rise again. Therefore, the added support from these previous lows on OSH appeared to indicate that the long-term downtrend for the stock might be over. That said, I still needed more proof that OSH had finished trending down and that it was starting a new uptrend to increase my probability of a winning trade.
It was also evident from Chart 1 that there were eight and half years between the lows of 1993 and December 2002, which indicated that the stock could be completing a long-term low. If this was correct, then OSH would be bullish for at least 18 months. To confirm that the stock had completed its long-term low and stopped falling, I needed to let the smaller moves in price unfold to see if it conformed to a bullish move.
In other words, the stock needed to rise and then fall back in price to test the low of $0.57. This is one area where many traders get into trouble because they jump into a stock that is perceived to be cheap before it has confirmed it has stopped falling, which is a high-risk strategy. What many don’t realize, however, is that there is a high probability, when a stock turns to test the low that it will fall straight through it. Therefore, it’s worth being patient to ensure you increase the odds of a winning trade.
Confirmation that the stock had stopped falling and was now more likely to be bullish came in April 2003 when it fell back down to $0.57 to confirm a double bottom with the low of December 2002, as shown in Chart 2 below.
Price and pattern confirmed the odds of a winning trade
Now I have price and pattern indicating that the stock has stopped falling, and if it starts to rise, as I previously stated it’s likely that OSH would be bullish for at least 18 months. So where would you have gotten into the stock?
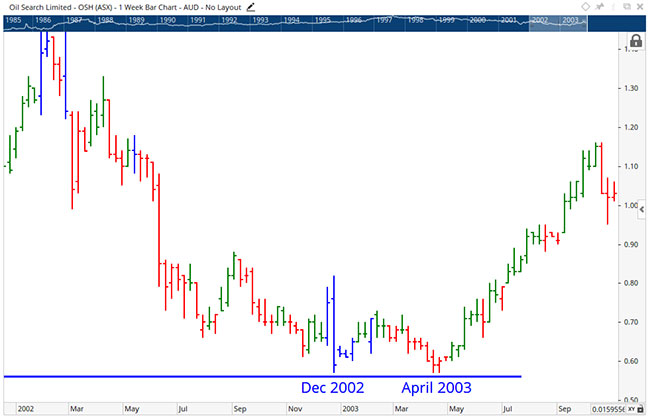
Chart 2
Given that we now a higher probability of the stock trending up, we can use trend theory to fine tune our entry point and increase the probability of making money sooner rather than later. Depending on your risk level, you could use trend lines on either the monthly or weekly chart to pin point your entry, as outlined in my latest book Accelerate Your Wealth.
Using a trend line on the monthly chart, your entry would have occurred on 2 June 2003 at $0.72. Because we had confirmation of a double bottom in addition to price moving above the downtrend line, the probability of success for this trade is around 70 per cent.
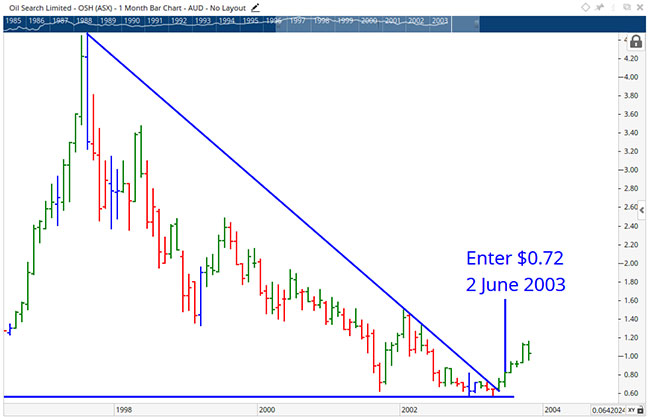
Chart 3
On the weekly chart, the first entry signal was triggered on the week ending 9 May 2003 when the stock closed above the downtrend line for two consecutive weeks, as shown in Chart 4 below. Given this, you would have purchased the stock the following Monday on 12 May 2003 at $0.64.
When applying trend lines as a standalone tool on a weekly chart, you will generally achieve a 60 per cent probability of success. However, the probability increases well above 70 per cent when you combine this with a double bottom and a strong support level.
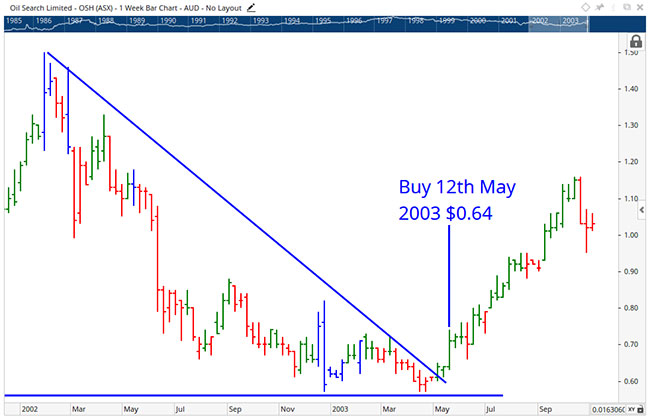
Chart 4
For the more conservative trader seeking further confirmation and a higher probability of success, the second signal to buy on the weekly chart occurred on 16 May 2003 at $0.73, when price broke up through the previous peak of $0.72 in March 2003 as shown in Chart 5 below. This trade is considered very low risk because the stock had already closed twice above a downtrend line.
By the end of October 2003, the stock was trading around $1.00, and after closing below the uptrend line on a weekly chart, it provided the signal to exit at $1.02, achieving a gross profit of almost 60 per cent in approximately five months.
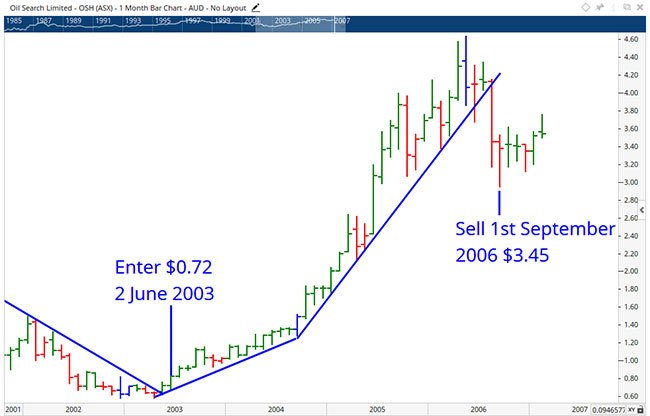
Chart 5
However, on the monthly chart the exit did not occur until September 2006 at $3.45, as shown in Chart 5, above, with the trade rising just under 380 per cent in around three years.
After exiting, OSH briefly traded sideways before continuing to rise up to a high of $9.88 in June 2014 with various entries and exits triggered along the way. Each of these trades were considered low risk and, therefore, winning trades given that the long uptrend was well underway.
Where is OSH heading?
If we look at OSH now (September 2019), you can see that after falling from a high in June 2014, it is once again finding strong support just above $6.20, as shown in Chart 6 below, which it has done on many occasions over the past six years.
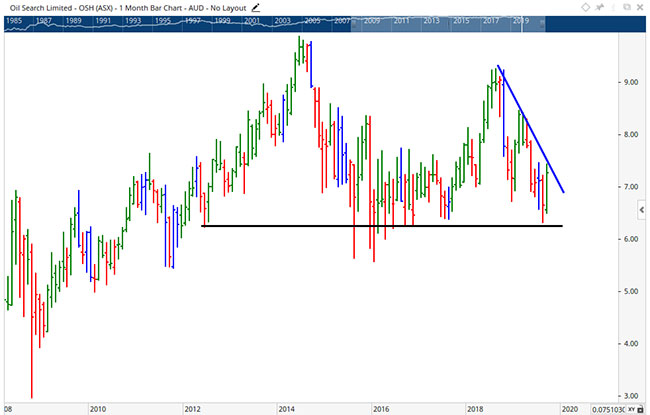
Chart 6
You can also see that OSH looks like it might cross above the downtrend line in the not too distant future to trigger an entry signal. Given the stocks history, your probability of a successful trade unfolding is much higher, as we know OSH is a stock that trends very well after finding support.
So, while we are looking to increase the odds of a winning trade unfolding, you need to be mindful that some trades do not turn out as we expected. It is for this reason why it’s so important to always consider the investment risks you are taking and to have money management rules, such as a stop loss, in place to ensure you are protecting your capital each and every time you trade.
Others who read this also enjoyed reading: