You Better Know These ASX Stocks If the Market Crashes: Buy Now
By Janine Cox and Fil Tortevski
What if the biggest risk to investors isn't a recession, a war, or even interest rates? What if it's a combination of sky-high AI valuations and a mountain of private debt hidden throughout the financial system? Investors have poured hundreds of billions into artificial intelligence over the past few years, while private credit has quietly grown into a multi-trillion dollar asset class fuelled by pension funds, super funds, and institutional investors all chasing higher returns.
If economic growth slows or defaults begin to rise, investors could quickly discover that some assets are worth far less than expected. So which ASX stocks could potentially offer a safer place to hide, or even profit, if the market turns? In the latest episode of the Australian Stock Market Show, Senior Analysts Filip Tortevski and Janine Cox, and Blueberry Markets' Zoran Kresovic break down the setup and reveal the stocks deserving close attention.
Why the Risk Backdrop Matters Right Now
History has a habit of repeating itself. We saw lofty valuations before the tech wreck. We saw them before the GFC. And we're seeing similar conditions building today. When companies that aren't profitable in boom times can't articulate when they will be profitable, that's a warning sign. Combine that with the largest IPO listings in recent memory, including SpaceX preparing to list on the Nasdaq under ticker SPCX with a valuation around $1.75 trillion, and the picture becomes clearer.
The 2008 crisis was triggered initially by private credit issues that then spread into stock and property markets. Today's AI boom carries similar bubble characteristics to the dotcom era, with valuations of 25 to 30 times earnings on many names, and Australian banks among the most expensive globally. When sentiment is ultra-bullish and IPO activity surges, what tends to come next is rarely comfortable for unprepared investors.
Defensive ASX Stocks Worth Watching
In previous downturns, healthcare and consumer staples have historically held up better than the broader market. Gold and certain commodity exposures have also offered hedging value. Finding individual names that can rise when everything else falls is genuinely difficult, but with careful analysis, opportunities do emerge.
1. CSL Limited (CSL)
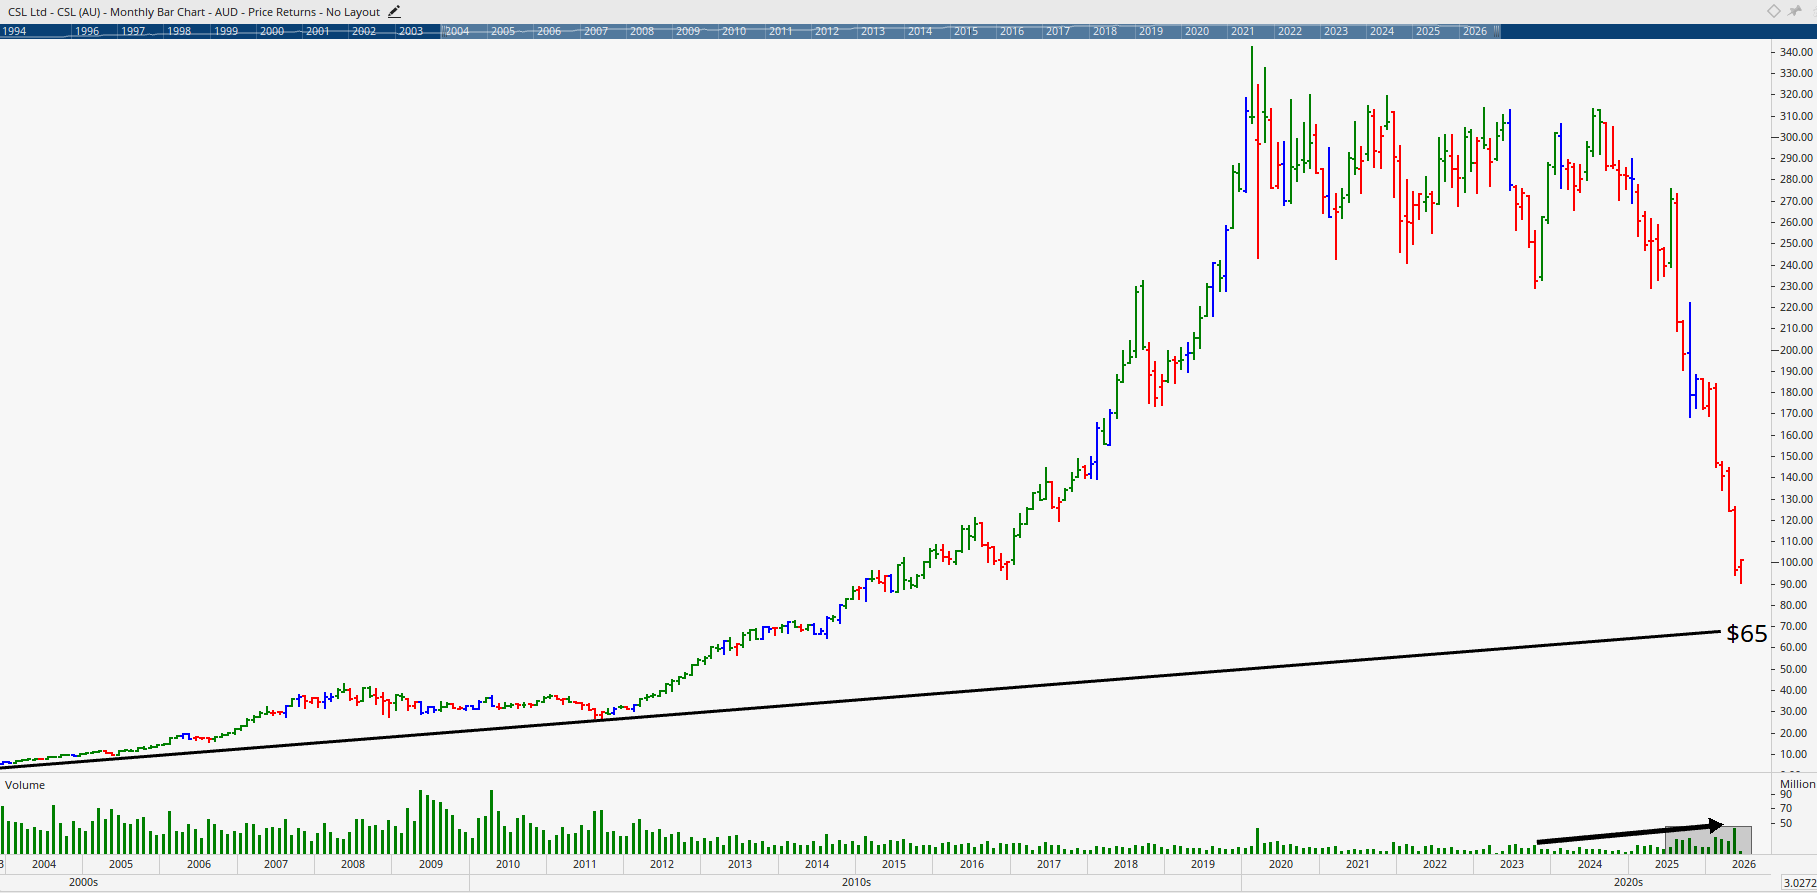
CSL has already fallen heavily and reached the level our analysts had previously identified. While that ticks one box, the angle of the trend points to a potential further fall toward the $60 to $70 mark, which existing investors would understandably prefer to avoid. The recent volume increase on the way down could indicate either capitulation or simply more sellers offloading, since markets go up by stairs and come down by elevator.
For now, CSL still looks like a falling knife. A weekly close above the recent high near $87 would provide much greater confidence that the bottom is genuinely in. Until then, patience is essential. The $55 to $60 zone represents a more attractive area to begin considering exposure on a shorter-term basis.
2. Woolworths Group (WOW)
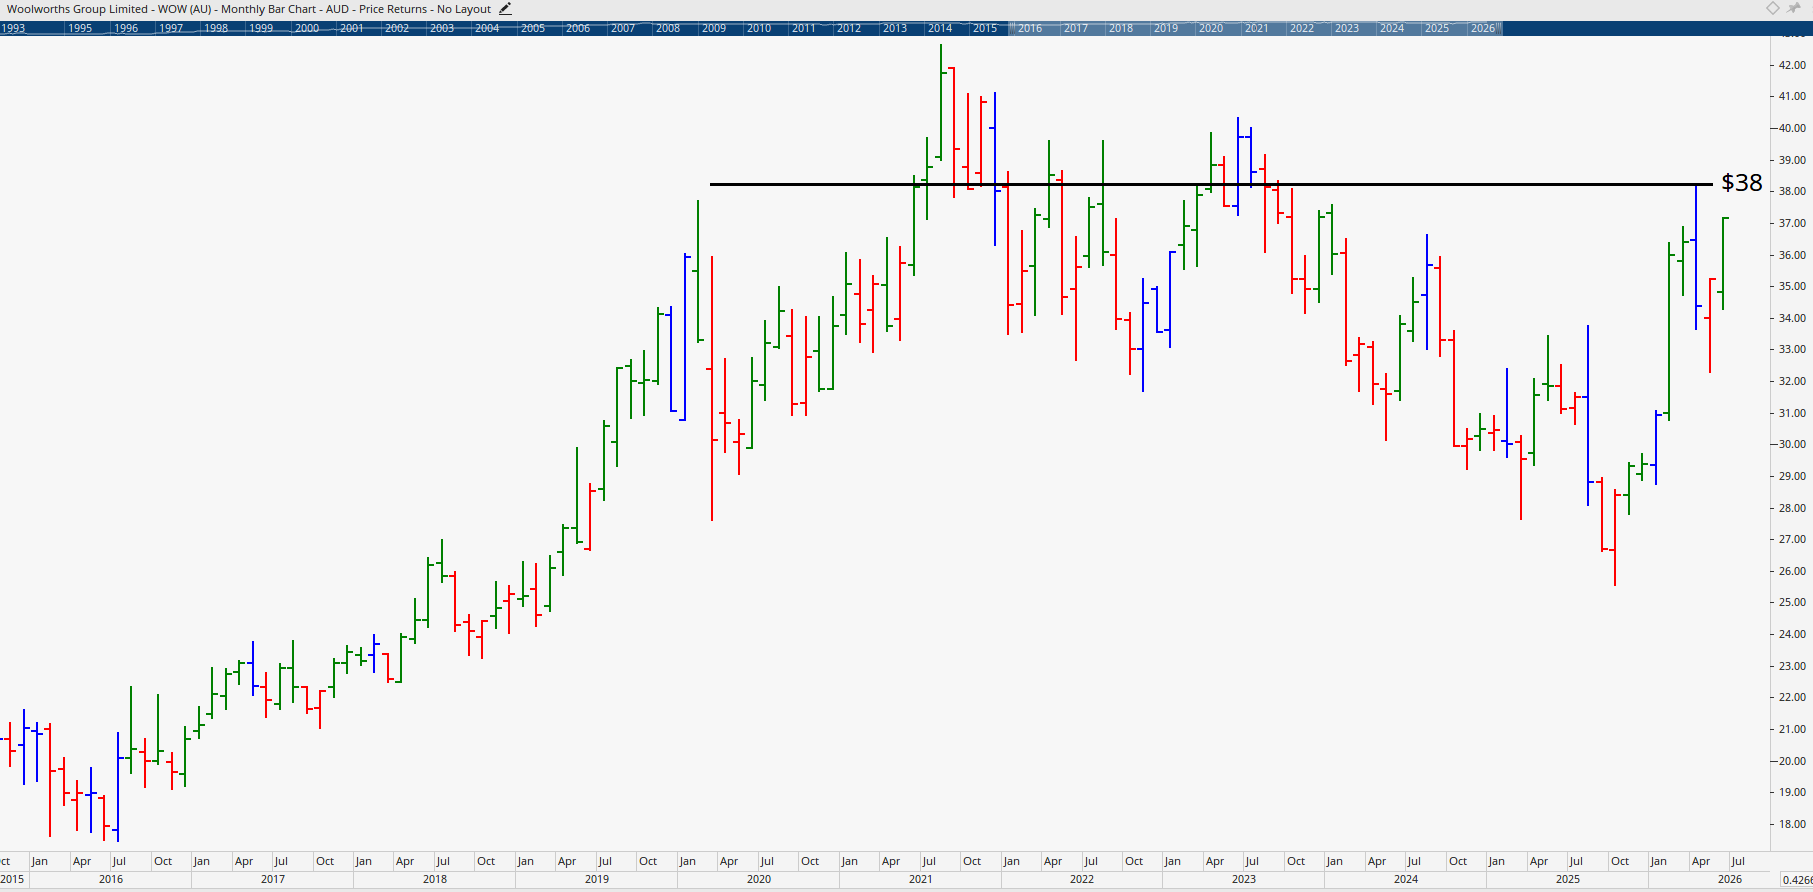
Woolworths is showing the inverse picture to CSL and looks genuinely interesting. The stock is breaking through a long-term downtrend line, retesting it, and now showing a bullish setup on the monthly chart heading into June. Taking out the high at $38.24 would open the door for further upside, particularly given the long consolidation period beforehand. Breakouts from extended ranges tend to be aggressive when they finally arrive.
The October 2025 low provides a clear point of support, and the weekly chart looks constructive. Volume hasn't fully confirmed the move yet, but as long as price continues creeping up, Woolworths looks like a sensible defensive holding. Investors who didn't catch the earlier move may have missed the strongest run, but there's still potential for a challenge of the previous high.
3. APA Group (APA)
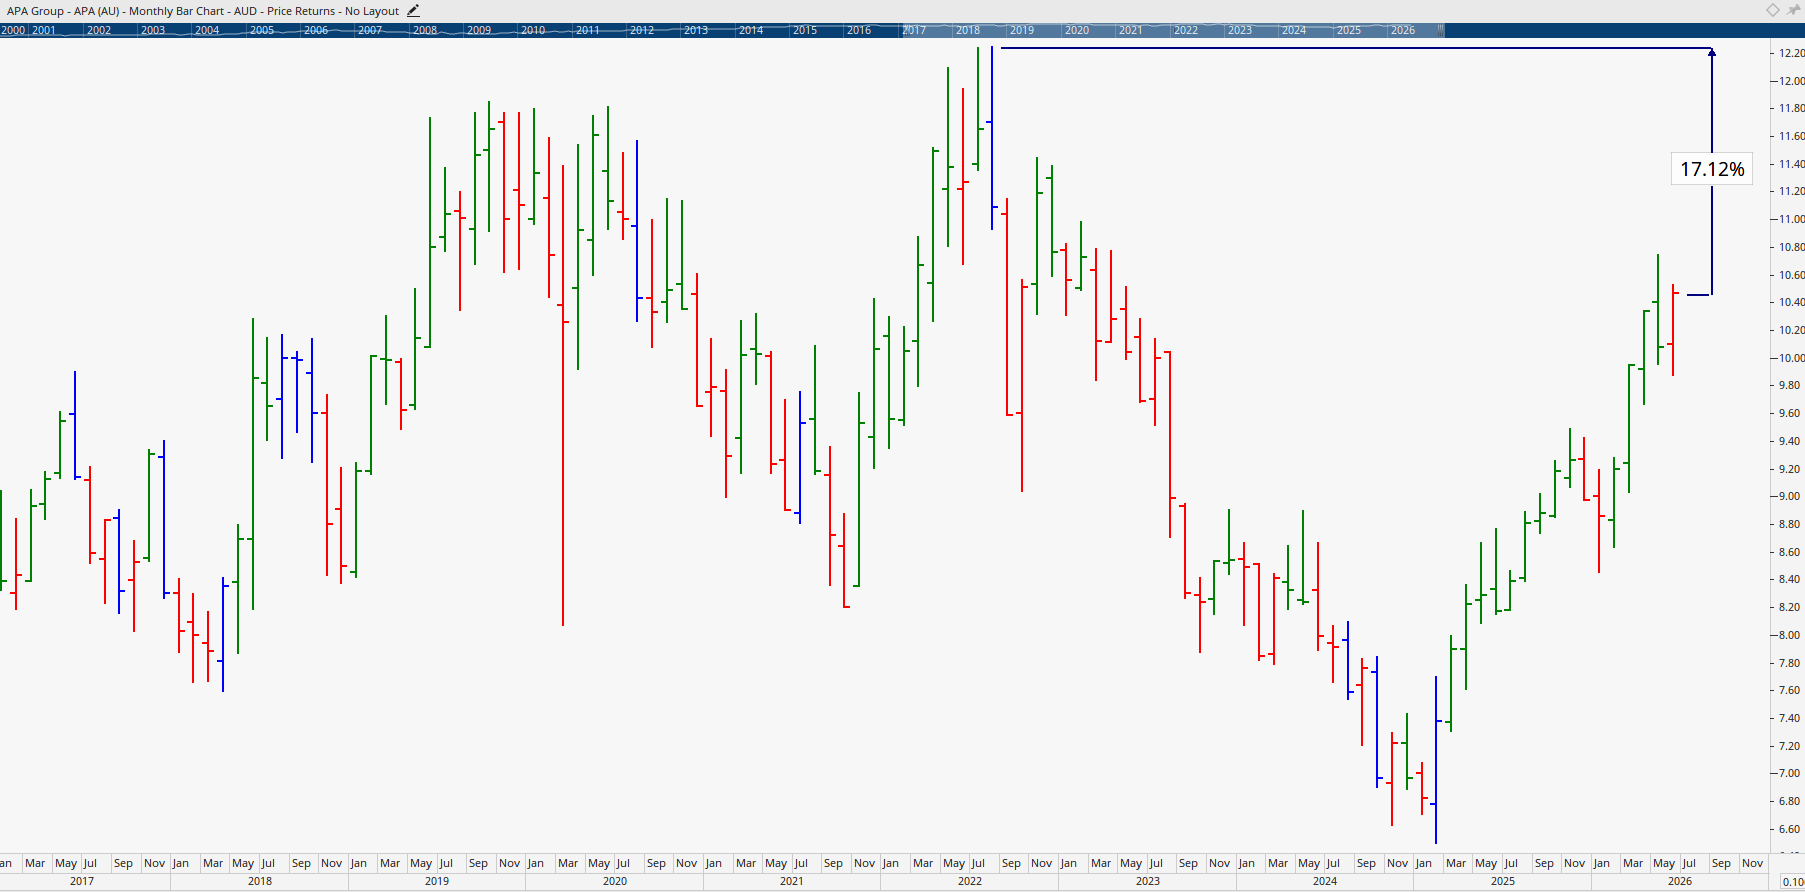
APA Group has had a decent rise, pulled back, tested support, and is moving again. There's still around 17% to the previous high, and the stock has broken through resistance more strongly than expected. The reversal currently forming, shown by the bullish weekly bar, demonstrates the strength of underlying support.
Even if APA pulls back through the recent week's low to consolidate before turning higher, that would form a constructive base for a run at the high and a potential break through $12. Patience here pays off, particularly waiting for confirmation that the consolidation is complete.
4. Transurban Group (TCL)
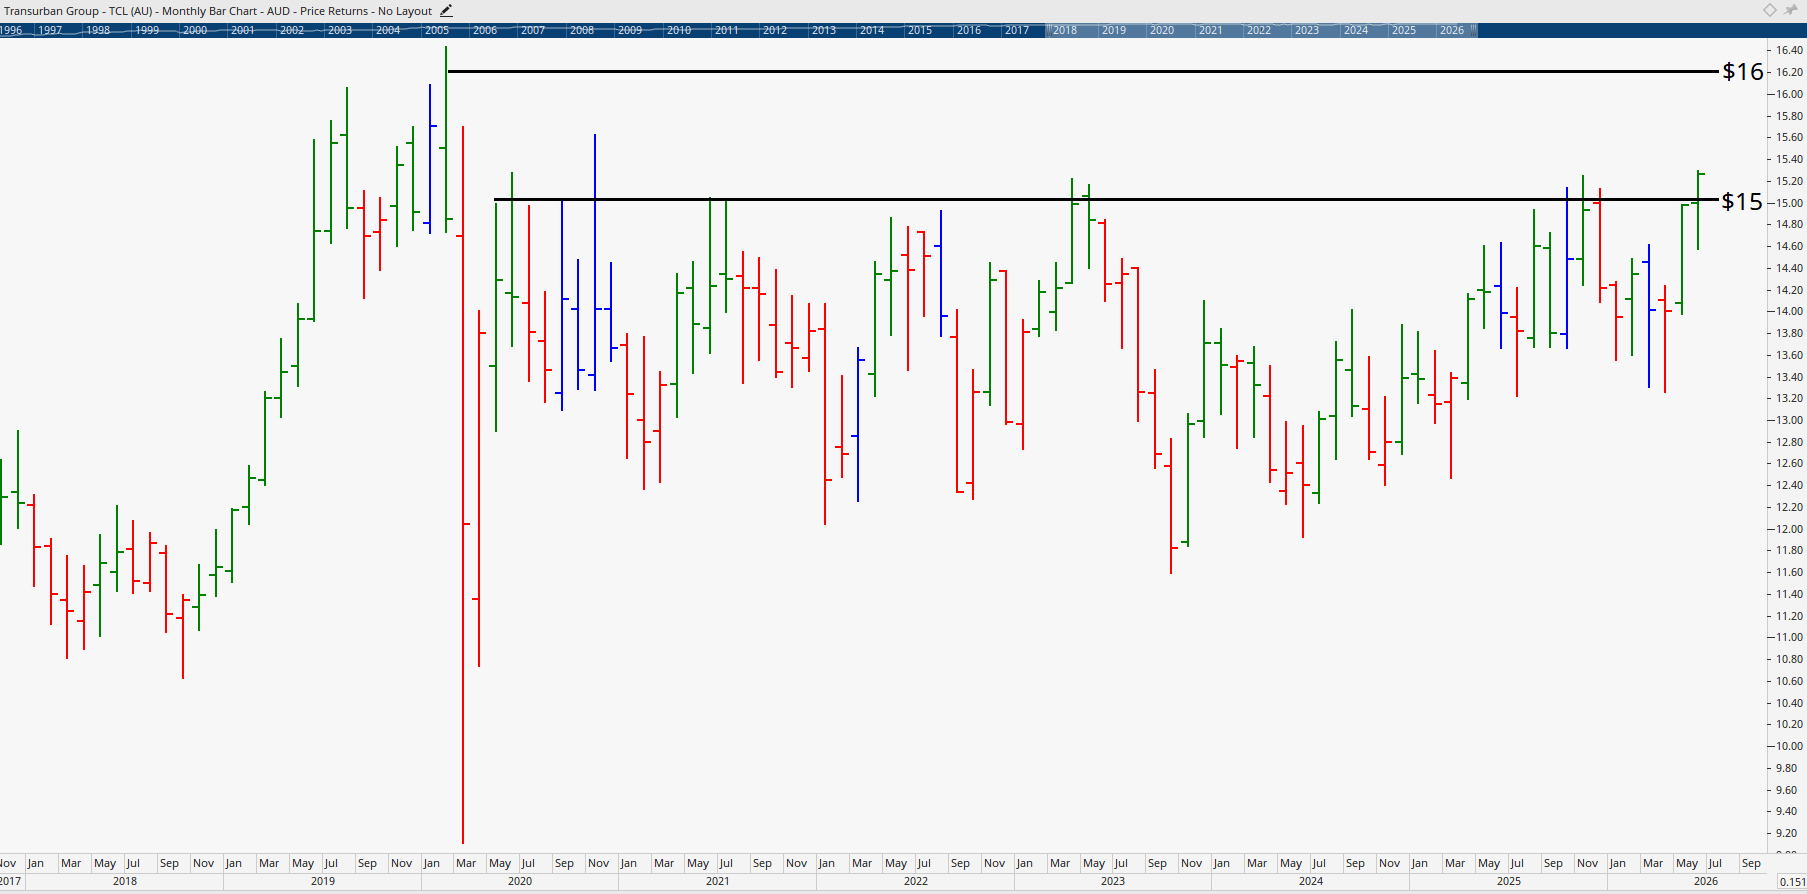
Transurban is hitting resistance around $15 and consolidating nicely. After establishing a major low back in October 2023, the stock has been trending up on monthly charts. A worthwhile exercise for traders is to compare TCL with CSL, since CSL consolidated for an extended period at market tops before falling sharply.
The key trigger for Transurban is taking out the February 2020 high of $16.20. If that breaks on a confirmed weekly or monthly close, the consolidation could simply be the prelude to the next leg up. Without that confirmation, however, patience is required. The lesson from CSL is clear: until the all-time high is genuinely broken, lengthy consolidations can resolve in either direction.
5. Santos Limited (STO)
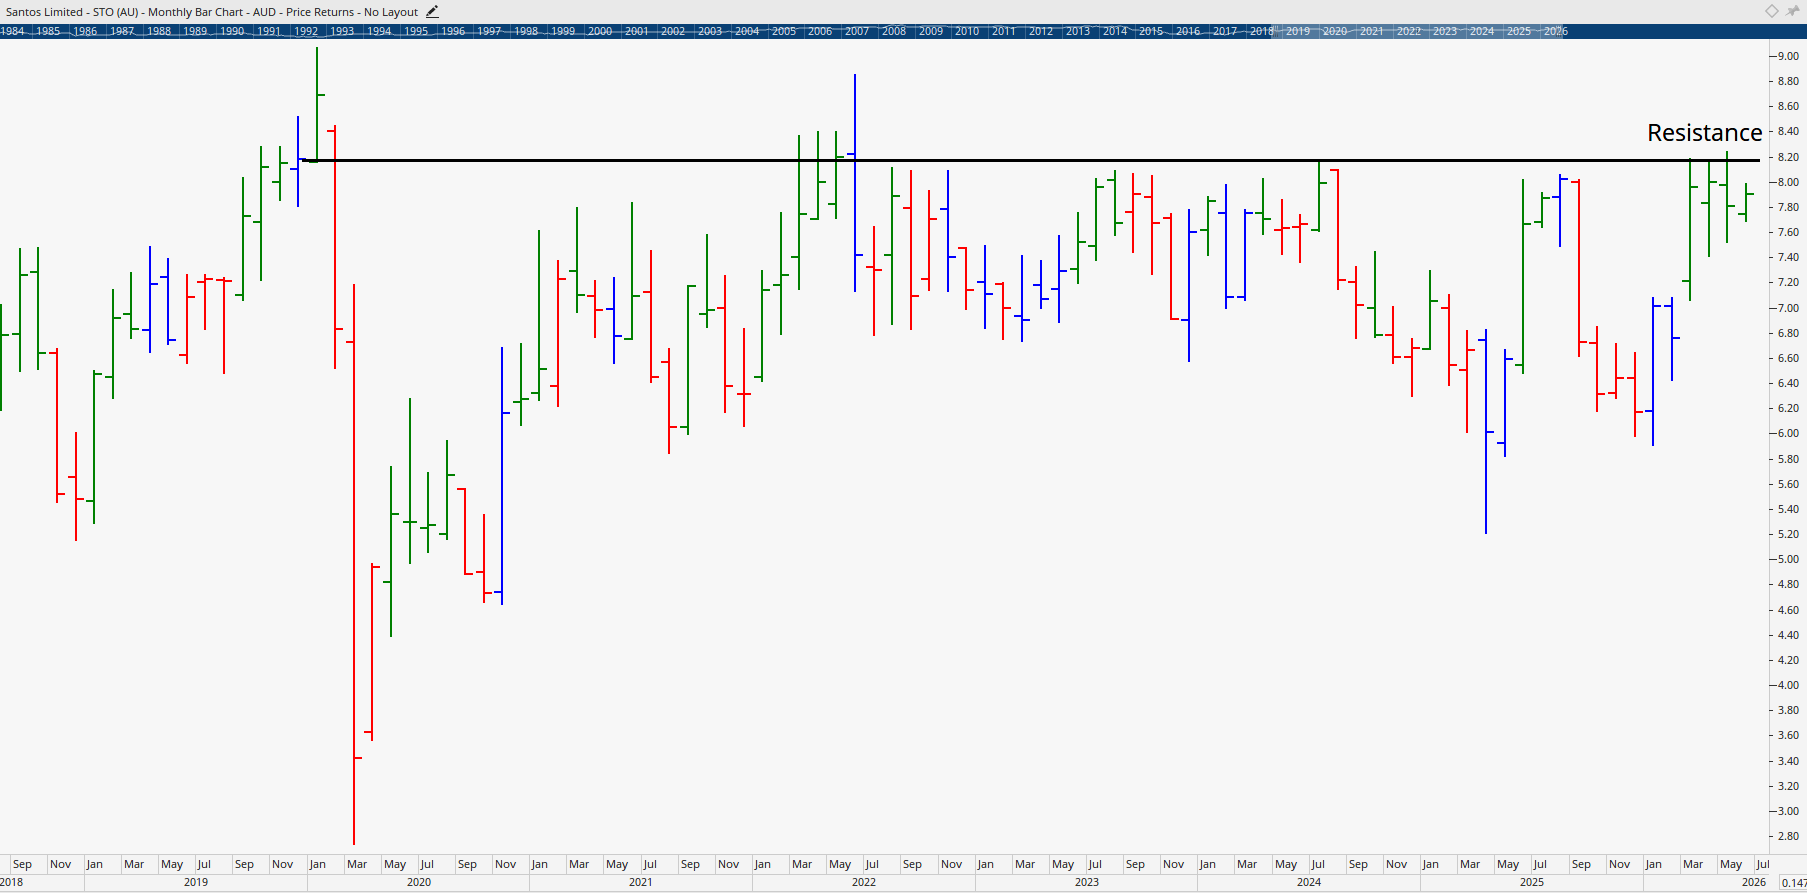
Santos is one of the more compelling setups discussed. There's a major resistance level overhead that has been a clear barrier on the chart. If price breaks above this zone, the path opens up for a meaningful run. Risk management is straightforward, with a stop loss able to be placed below the recent consolidation low on the weekly chart.
What makes Santos particularly attractive is that it has taken out a previous lower high, which was the critical point. For more conservative entries, waiting for a confirmed break and a pullback to retest the level provides a lower-risk opportunity. Stocks that consolidate sideways for years often produce the cleanest, most aggressive breakouts when they finally move, and Santos fits this profile.
6. Woodside Energy (WDS)
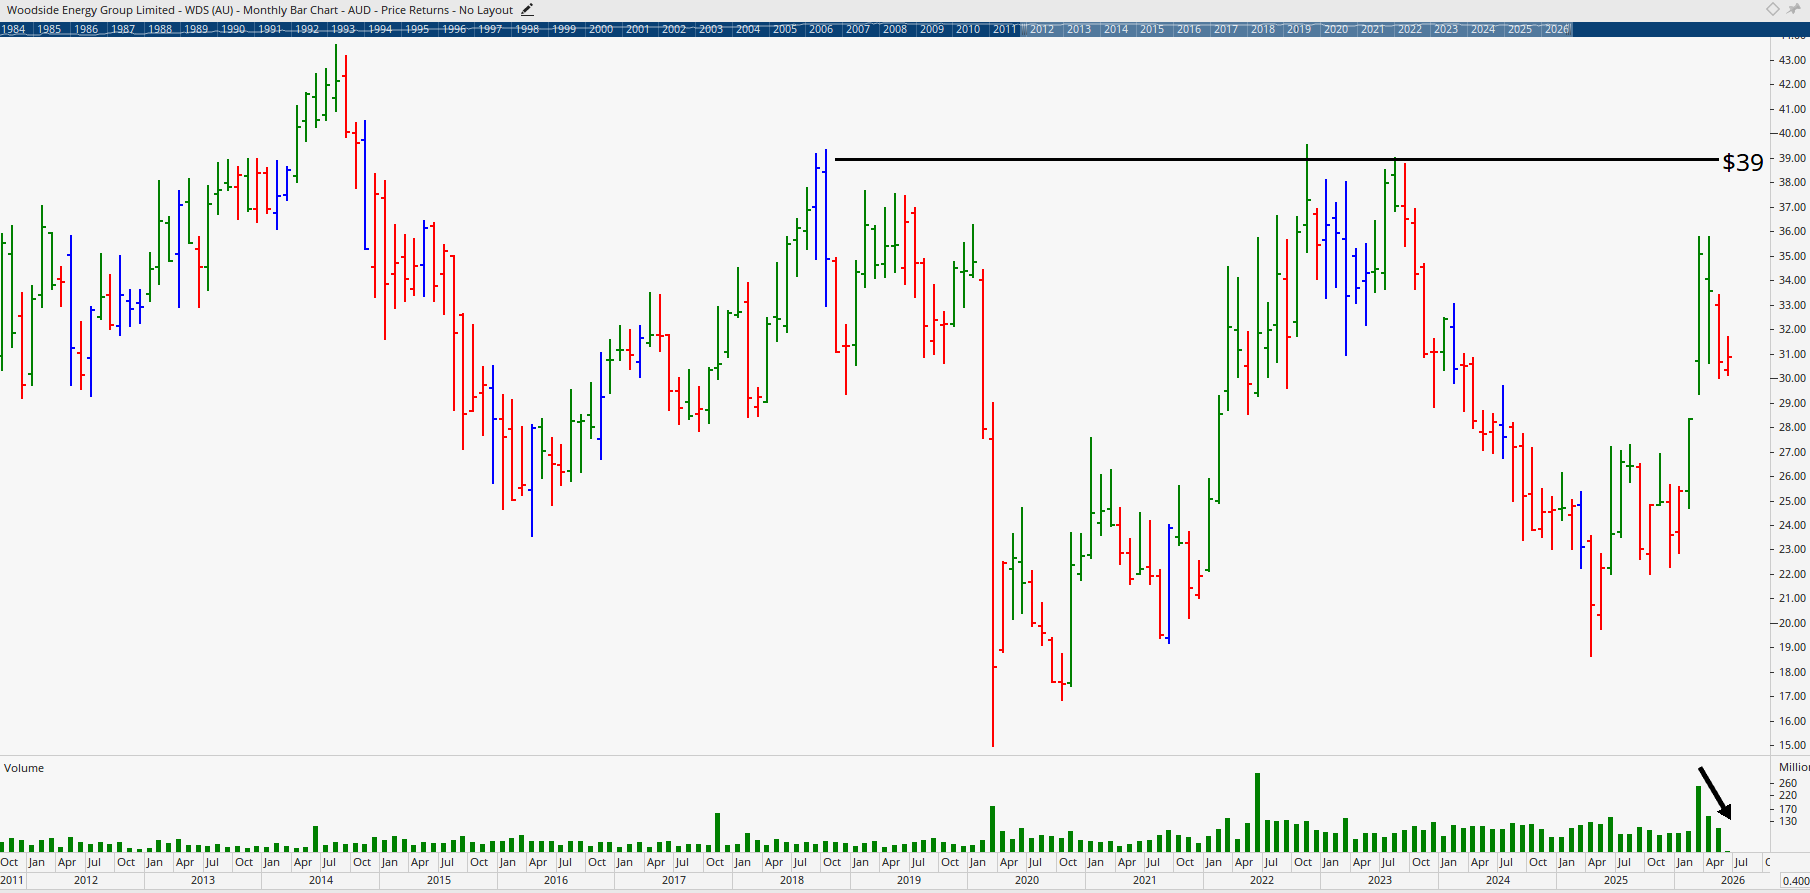
Woodside Energy presents a similar picture to Santos but slightly less compelling technically. The stock has a gap which looks likely to be closed, which is actually constructive. If price can reverse and take out the April 2026 high of $35.80, the path opens toward $39 to $40, with longer-term targets in the $45 to $50 range.
Volume on the weekly chart is coming off alongside price, which suggests sellers are drying out, but confirmation is still needed. Both Santos and Woodside offer defensive energy exposure with attractive technical setups for patient investors.
7. Northern Star Resources (NST)
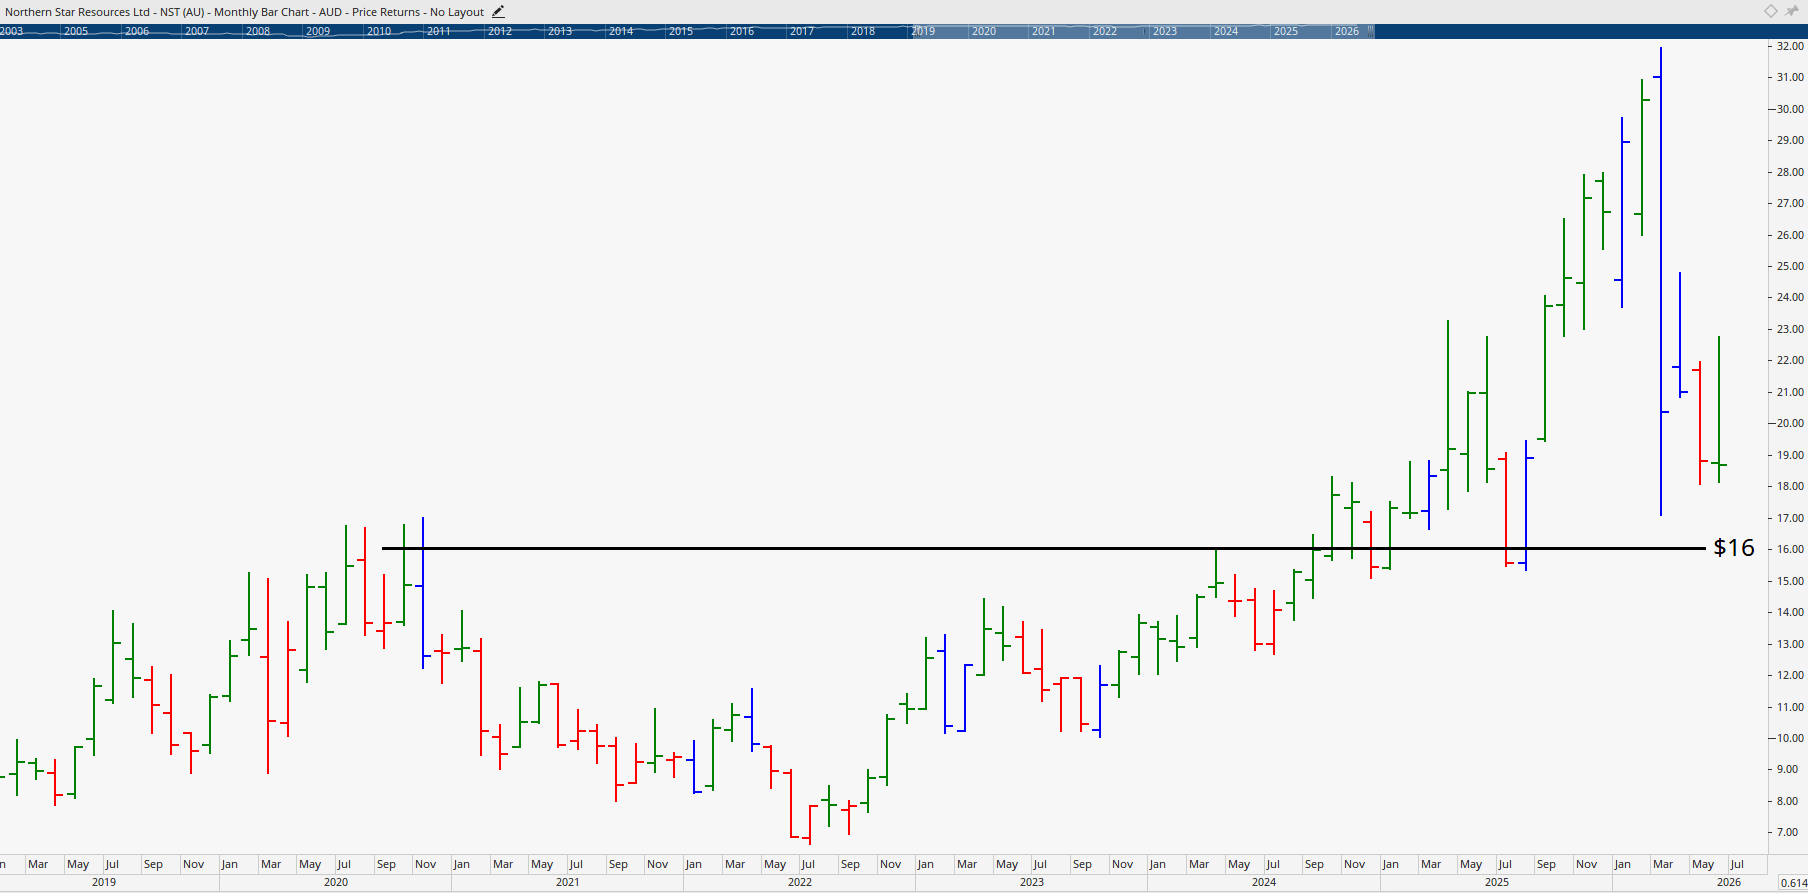
Northern Star has had a substantial 46% sell-off from its high, retesting all the way back to November 2020 levels. While investors who bought near the top are nursing significant losses, the correction has created a major opportunity for new entrants. The stock is now testing levels last seen six years ago at $16.
History tells an interesting story here. After a similar test of a previous high in 2016, Northern Star produced one of its most significant runs, gaining 185% to its 2020 peak. A move back to $40 is realistic if the stock can hold this base and turn higher. With gold's recent correction creating better value in the sector, NST deserves close attention as the bottom forms.
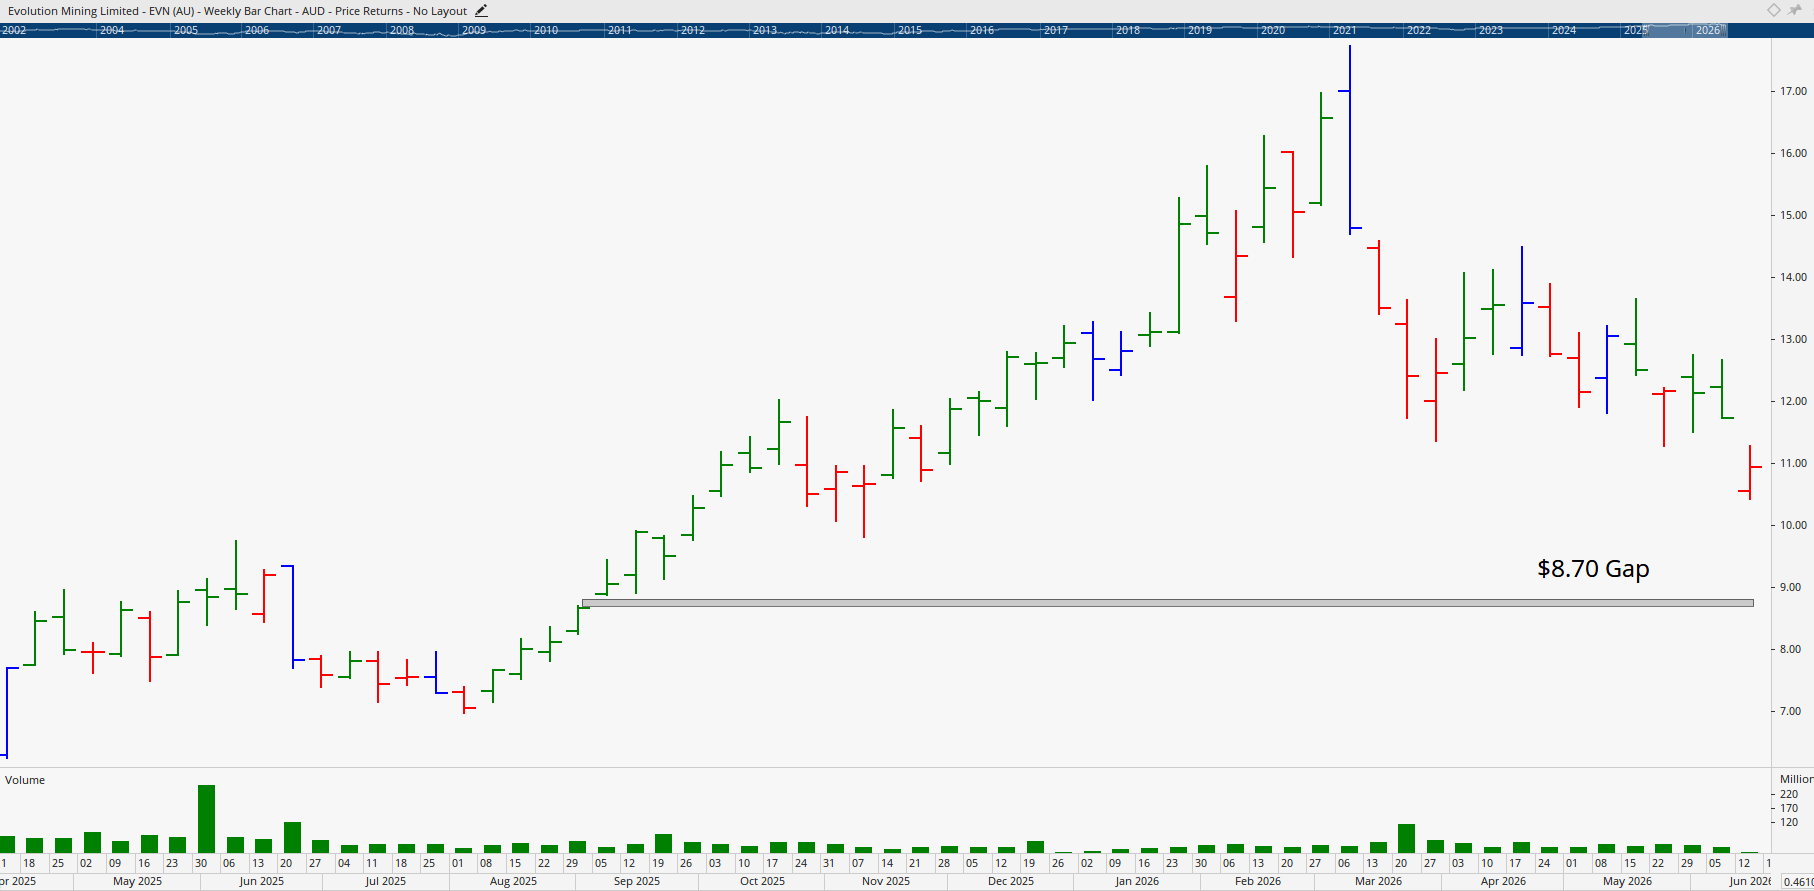
8. Evolution Mining (EVN)
Evolution Mining looks bearish in the short term, with an outside bar, inside bar, down bar, and another inside bar forming. Taking out the low of $11.27 would likely see the stock fall to close a gap between $8.68 and $8.72, with potential further downside to $6.50 to $7. That zone represents a much more attractive entry point.
Fundamentally, with US Treasury yields rising, three recent Australian interest rate hikes, and a 65% market-implied probability of further Fed action, the macro environment may keep gold and silver under pressure for now. Patience here will likely be rewarded with better prices.
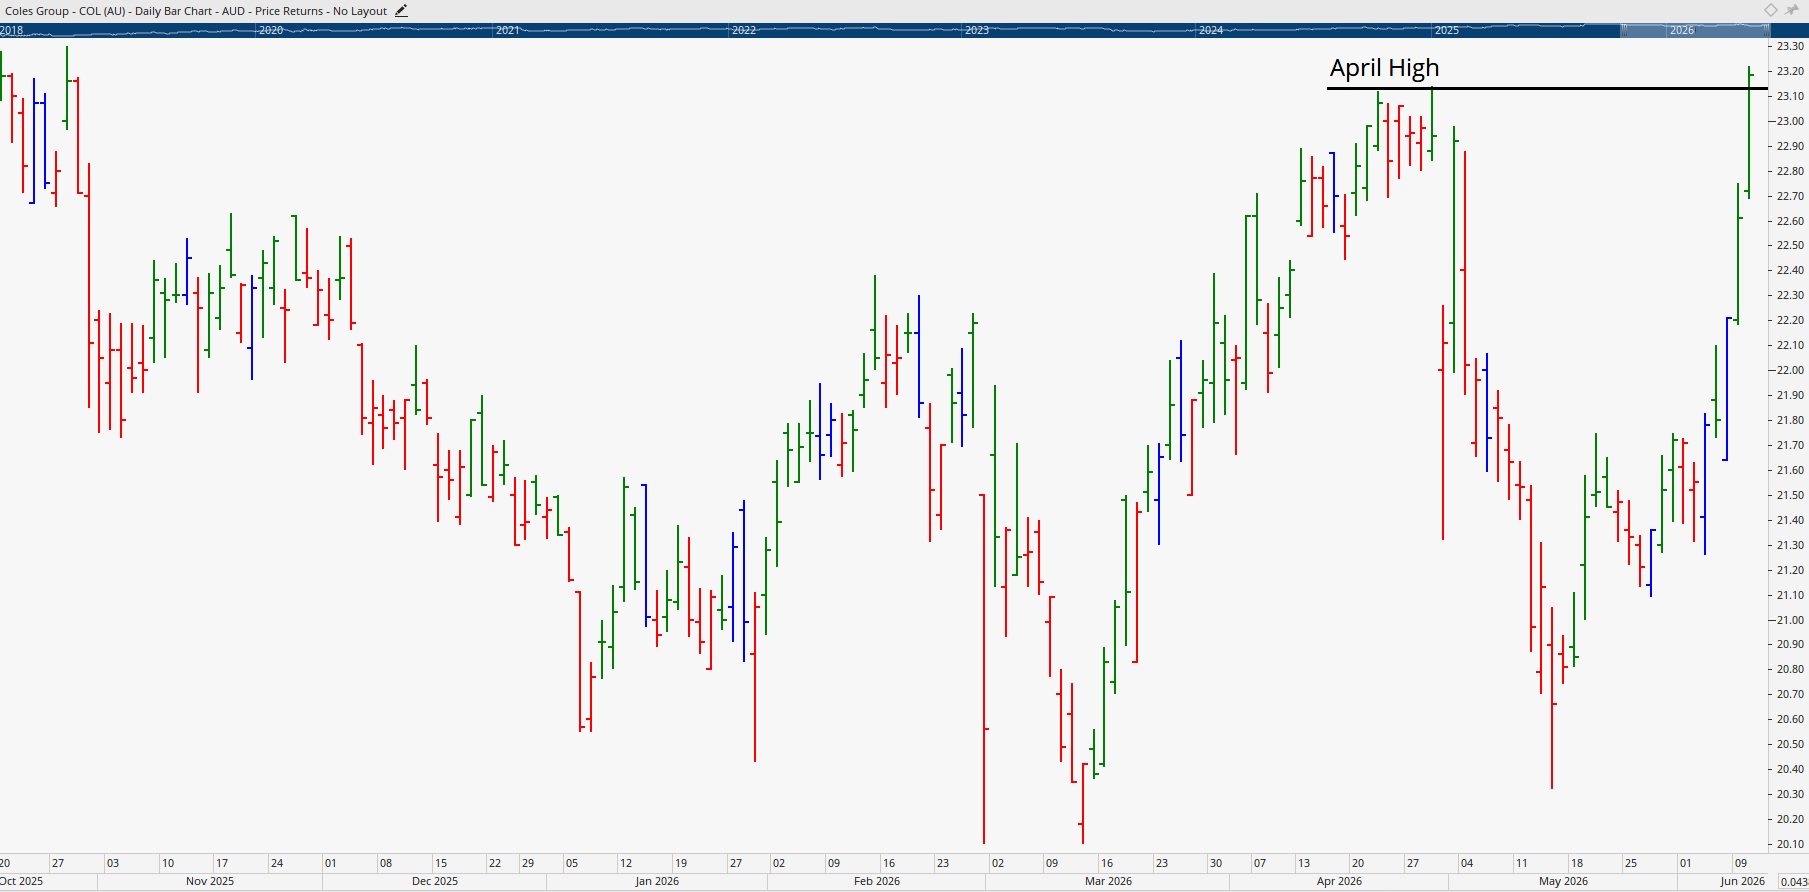
9. Coles Group (COL)
While Woolworths has been running, Coles has been consolidating. Once it breaks through the April 2026 high, Coles could push toward $27. The longer the sideways action continues, the more important it becomes to watch the downside, but for now Coles is holding up well. Sector rotation between Coles and Woolworths is a common pattern as managed funds shift exposure between the two, so missed opportunities in one often appear in the other.
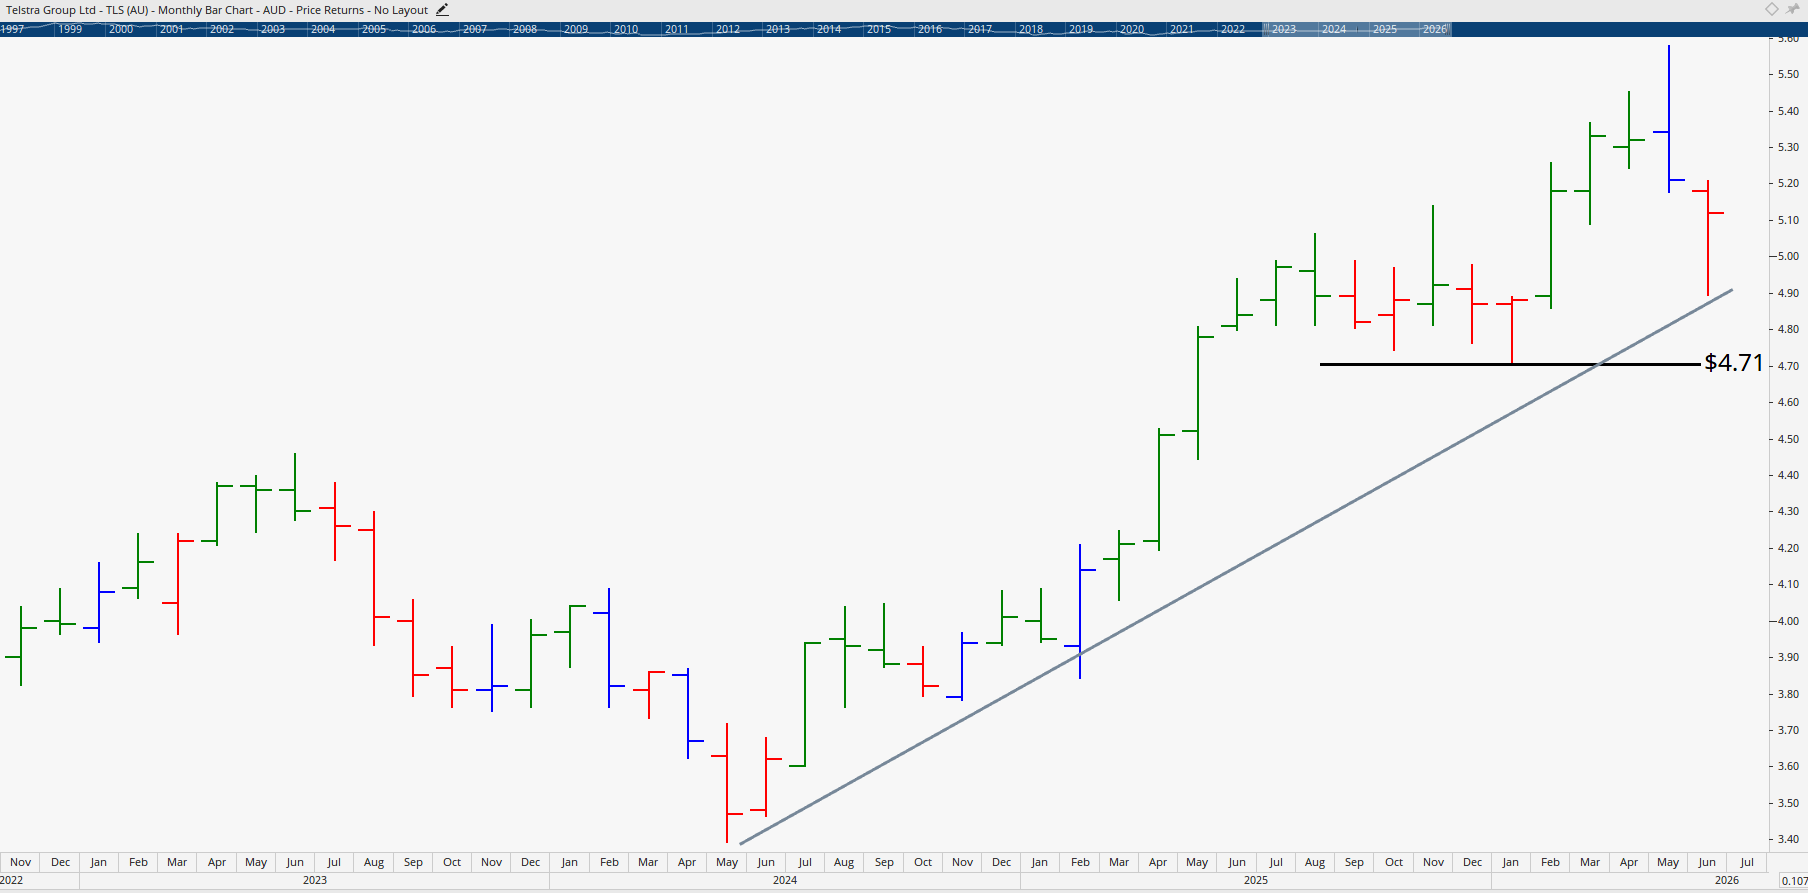
10. Telstra Group (TLS)
Once the darling of the market, then the dog of the market, Telstra now looks solid. Major lows formed in 2018 and during COVID in 2020 have held, and the narrative around the stock is genuinely changing. The stock has broken into another uptrend and is now coming back to test it.
If Telstra holds above the $4.71 low, momentum could carry it toward $6 and ultimately a test of the February 2015 major high. With strong yield, top-20 status, and significant volume, Telstra remains a darling for fund managers and asset managers seeking income and stability.
Trending Topic: Should Australians Buy SpaceX?
SpaceX is scheduled to list on the Nasdaq under ticker SPCX on 12 June with a valuation around $1.75 trillion, making it the seventh biggest company in the US by market cap. By revenue, however, it would only rank around the 200th largest. That alone should sound alarm bells.
Analysts have warned the valuation is being derived from future expectations of orbital data centres and Elon Musk's reputation for building innovative companies like Tesla. Last year, SpaceX reportedly received around $6.8 billion US and spent $20 billion. The fundamentals indicate the company is unprofitable.
Around 50% of all IPOs trade well below their offer price within 12 months of listing, particularly those driven by hype. The smarter approach is typically to wait for the inevitable sell-off as existing shareholders and insiders offload their holdings. Looking at Tesla as a guide, the stock surged 60% in its first month after IPO, then fell 50% the following month, and trundled sideways for years before its eventual 2013 breakout. Timing matters enormously.
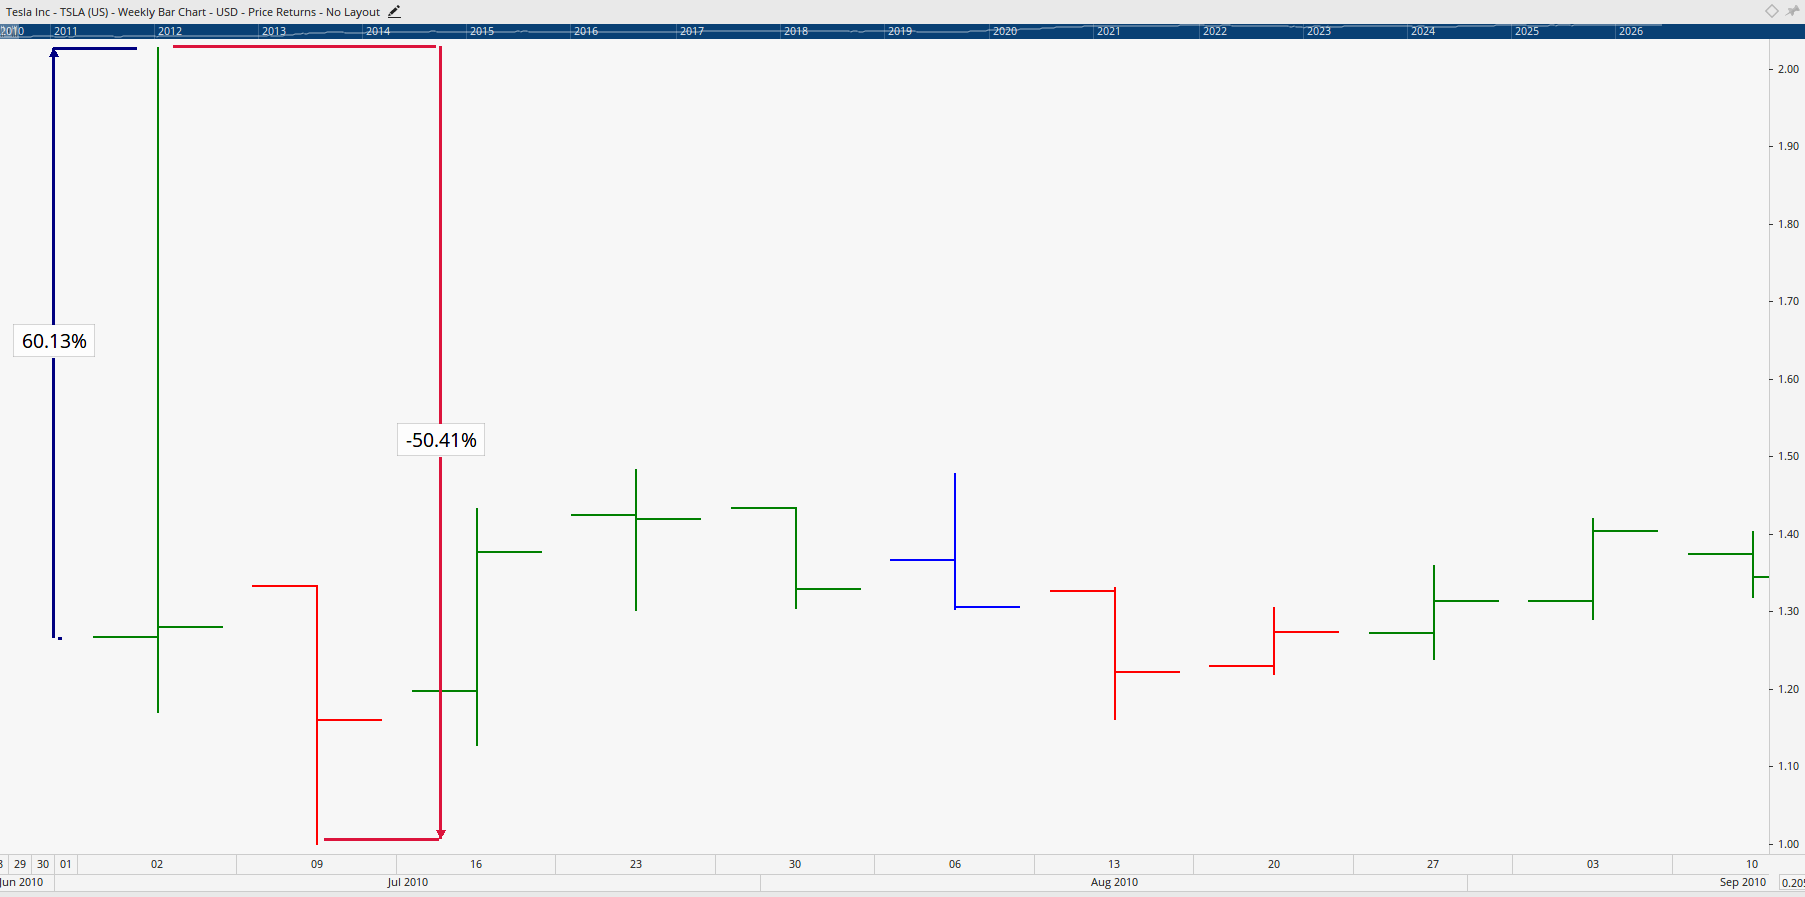
The lesson is straightforward. Understand your risks first. Learn how to read a price chart so you can time your entry and reduce risk. Once initial hype fades, you can also determine how much you could potentially make. Falling in love with a story without separating it from disciplined investment decisions is a fast path to losses.
Reader Questions: What the Charts Are Telling Us
Is the Stock Market Still a Good Indicator of the Economy?
Paul asked whether the stock market still reflects the broader economy. The honest answer is that there has always been a disconnect, with markets typically front-running the economy by six to twelve months. Today's environment, with stock markets at all-time highs while cost-of-living pressures bite, illustrates this clearly.
The bigger issue is the increasing concentration of capital into mega-cap stocks via ETFs, which can widen the disconnect between market performance and economic reality. The takeaway for investors is to flip the mindset from prediction to risk management. Focus on going from point A to point B profitably, regardless of what the broader economy is doing. Sector and technical analysis will reveal what's actually happening across the market, and that's where opportunities live.
Will AI Drive a Once-in-History Transformation?
Adam wrote in suggesting AI could resemble past technology booms while having key differences, including profitable AI leaders, geopolitical strategic value, and a once-in-history transformation potential. The story may well prove true, but markets don't reward stories. They reward timing, valuation, and risk management.
Rewind to 2000 and the internet was supposed to revolutionise the world. It did. But valuations still had to be reset before the real long-term winners emerged. Separating the story from the investment process is essential. If you fall in love with a narrative without allocating for risk, the market will eventually punish you regardless of how transformative the underlying technology proves to be.
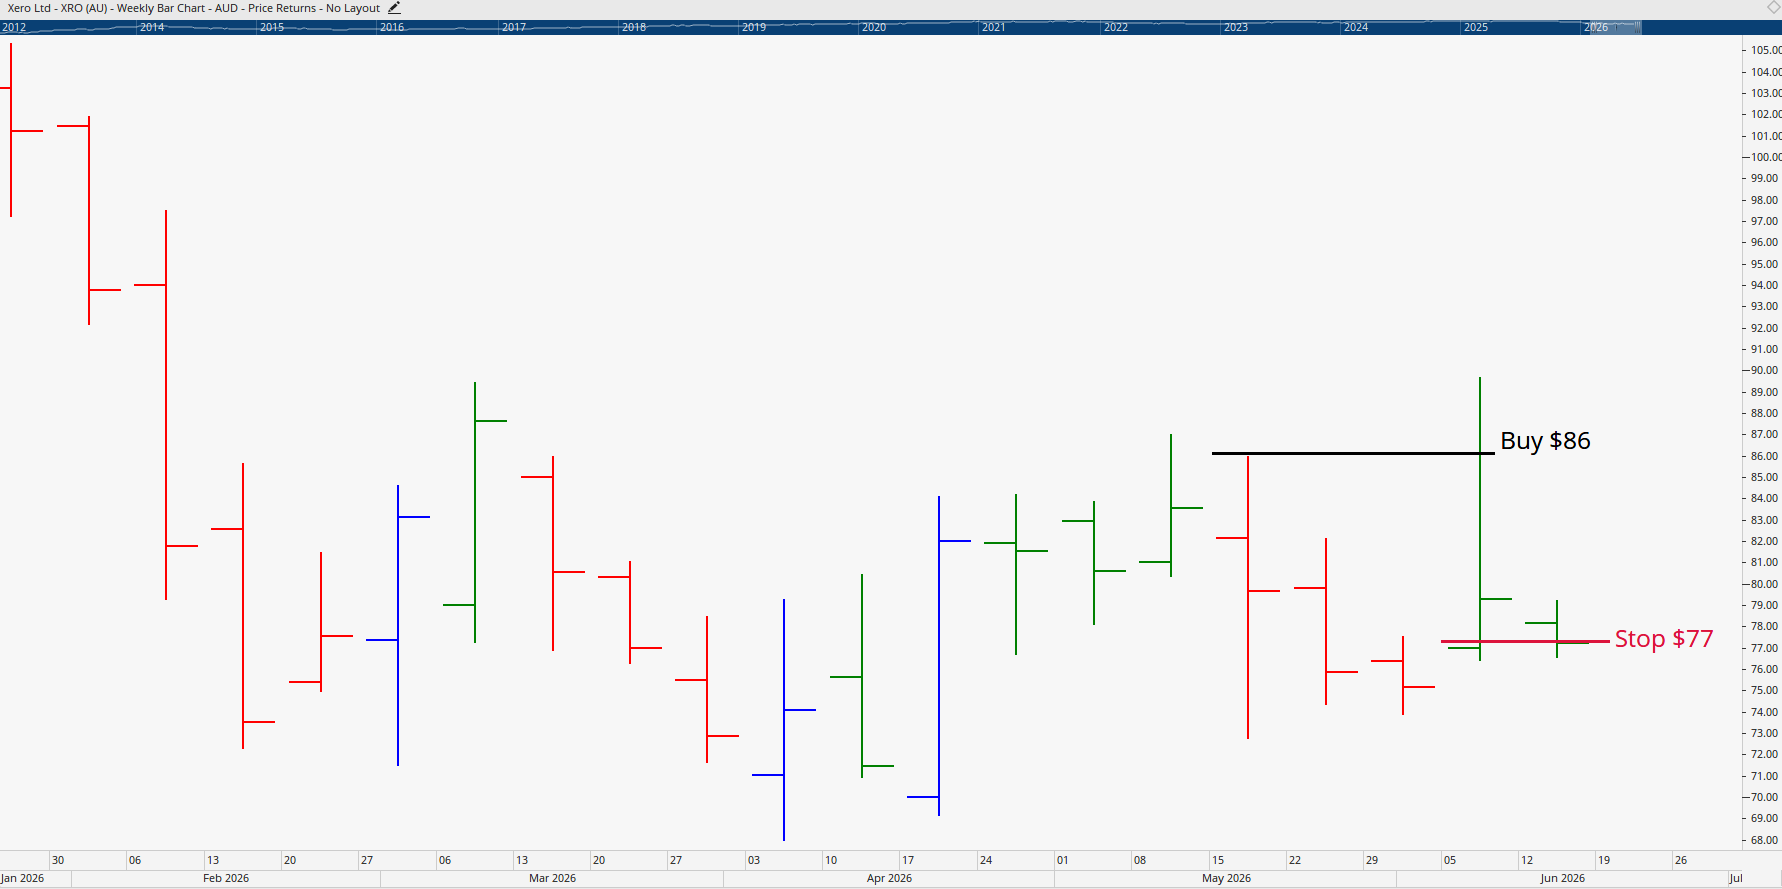
Xero Limited (XRO)
Daniel took a position in Xero at $86 with a stop loss at $77. The setup is interesting on the right-hand side of the chart, where the stock may be forming a major low above the 2022 low. However, the stop loss looks too tight given the volatility of the move that preceded it. There's a real risk of being whipped out before any meaningful move higher unfolds.
A weekly close above the previous high near $87 would provide better confirmation that the trend has turned. For risk management, a stop below the major low at $67.93 would align better with the structure of the consolidation, accepting that breaking that level would genuinely indicate further downside is likely.
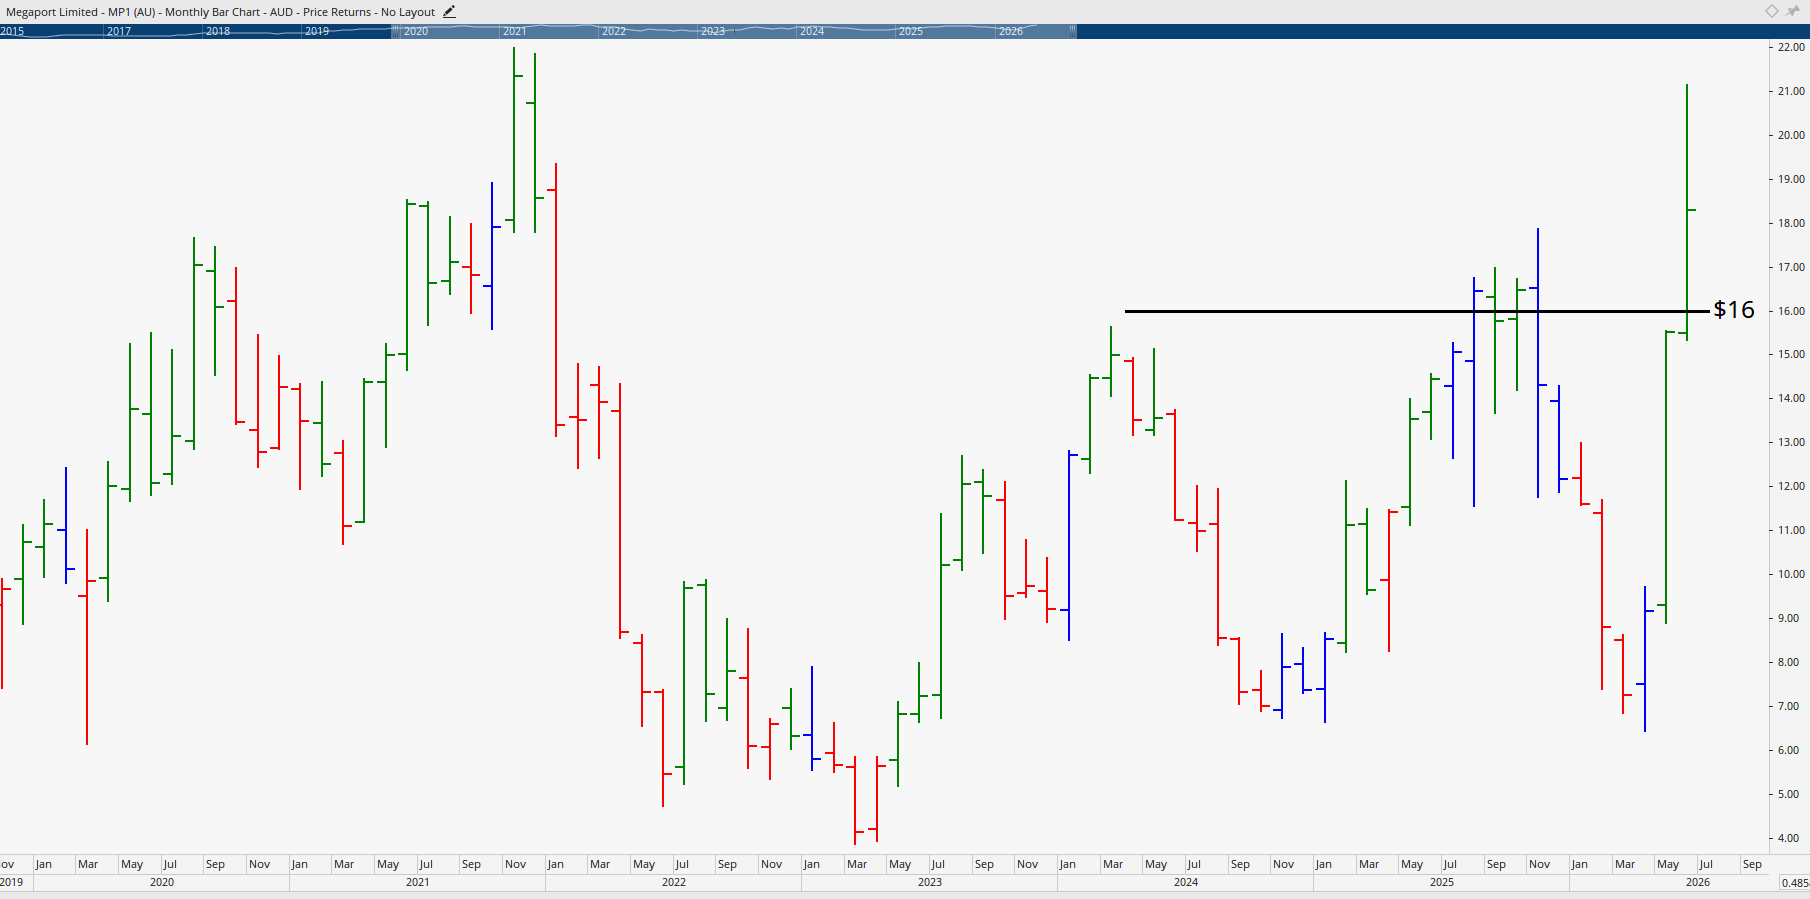
Hot Stock Tip: Megaport Limited
The hot stock tip this week is Megaport Limited. The company recently raised approximately $511 million through the institutional component of its $827.3 million entitlement offer, with shareholders taking up 99% of entitlements. The funds will be used to acquire NVIDIA GPUs and build AI computing infrastructure for customers.
CERE has lifted its target price 41% higher to $22.10, increased its FY27 EBITDA forecast by 73%, and described execution risk as manageable. Technically, the stock has surged 131% in a very aggressive move. The all-time high around $21 to $22 represents the major point of resistance overhead, and the move looks emotional in the short term.
A pullback to retest support around $16 would create a much more attractive entry point. Alternatively, a confirmed weekly or monthly close above $22 would signal continuation of the uptrend and provide a short-term entry opportunity. Either way, this is a stock to watch closely as the AI infrastructure theme continues to attract serious capital.
The Real Lesson: Skill Beats Speculation
Whether the market crashes next month or continues higher into 2027, the same fundamental truth applies. Investors with the skills to read price action, manage risk, and identify the right setups will always outperform those relying on tips, hype, and headlines. Concentration in ETFs and mega-cap stocks may make the next correction sharper than many expect, which means structured education becomes more valuable than ever.
This is exactly what we focus on at Wealth Within. Our share trading education teaches you how to identify these setups for yourself, so you're never reliant on someone else's view to make your decisions.
For those starting out, the Short Course in Share Trading builds the foundational skills required to trade safely and confidently in any market condition. If you're ready to commit to a comprehensive, government-accredited program, the Diploma of Share Trading and Investment teaches a proven five-step approach to becoming a consistently profitable trader. And for graduates wanting to refine their edge with techniques like time analysis and Elliott Wave, the Advanced stock trading course is the natural next step.
Final Thoughts
Markets can stay overvalued for longer than most investors expect, but eventually fundamentals reassert themselves. With AI valuations stretched, private credit risks growing, and IPO activity at frothy levels, the smartest investors are positioning defensively while remaining alert to opportunities that emerge from corrections.
Santos stands out as the favourite pick of our analysts, with its long consolidation and clean breakout setup offering an attractive risk-reward profile. Telstra and Northern Star also offer compelling setups, while Woolworths, Coles, APA, and Transurban provide defensive exposure with technical structures worth watching. CSL and Evolution Mining still look better left for now, with patience likely to deliver better entry points.
As always, the difference between profiting in volatile markets and being caught out comes down to skill, structure, and discipline. Identify the levels, wait for confirmation, and manage your risk. With the right education and approach, opportunities like these become far easier to act on with confidence.
Disclaimer: This article is general in nature and does not constitute personal financial advice. Always conduct your own research or consult a licensed adviser before making investment decisions.