Rising US Bond Yields Hit 5%: What It Means for ASX Investors
By Janine Cox, Fil Tortevski and Pedro Banales
Reading Time: 9 minutes
General Advice Disclaimer
You acknowledge that the information provided by Wealth Within is intended for general use only and does not take into account your investment objectives, financial situation or advisory needs, nor does the information provided constitute investment advice. For this reason, any individual should consider the appropriateness of the information, having regards to the individual's objectives, financial or taxation situation and needs before acting on this information, and, if necessary, seek appropriate professional advice. In addition, it is important to understand that the risk of investing in the stock market is that you could lose some or all of your money. For more information please refer to our Terms and Conditions.
Bonds are back at levels we haven't seen since the Global Financial Crisis. The US 30-year Treasury yield has surged above 5%, markets are getting nervous, and investors everywhere are asking the same question: is it time to sell everything?
In the latest episode of the Australian Stock Market Show Wealth Within's Senior Analysts Filip Tortevski and Janine Cox was joined by Pedro Banales to break down what rising bond yields really mean for shares, which sectors get smashed, which sectors actually thrive, and the carefully selected ASX stocks that could benefit if this trend continues.
Why Rising Bond Yields Matter
Bond yields have always been a red flag for share markets. When inflation continues to tick higher and bond yields rise alongside it, costs go up across the economy. The flow-on effect is that the value of assets gets re-rated downwards, which effectively means lower share prices.
Companies with high growth expectations, such as tech stocks, can be significantly affected because their future earnings become less valuable when discounted at higher rates. Investors initially panic about this kind of environment, but panic is rarely the right response.
Rising bond yields can be driven by two very different forces. The first is a structural economic issue or recession on the horizon. The second is simply increased government spending and higher demand for capital, fuelled by themes such as artificial intelligence investment and defence spending. When demand outstrips supply, yields naturally rise.
Right now, the situation does not appear to be a structural issue, which means the case for outright panic is weak.
The US 30-Year Treasury Yield: A Closer Look
The US 30-year Treasury yield recently pushed above 5.1%, the highest level since before the Global Financial Crisis in 2007. Reuters and MarketWatch both reported that investors are becoming increasingly concerned about sticky inflation, government debt levels, and the possibility that rates stay higher for longer.
Looking at the long-term chart, bond yields have been in an easing cycle since 1981, with that downward channel respected all the way down. We hit the low point in 2020 and have been rising since. We are currently sitting at around 5.03% yield, right back at June 2007 pre-GFC levels.
When you overlay recession periods on the bond yield chart, a pattern emerges. Bond yields started rising before the recessions of 1980, 1990, 2001 and 2007. However, during the GFC, bond yields didn't actually rise as much as we are seeing right now. So while we are at similar levels to pre-GFC, the broader environment is not exactly the same.
Don't Panic, Position Instead
Here's the twist: rising bond yields do not automatically mean you sell everything. Historically, several parts of the market can perform very well in a high-yield environment.
Banks can benefit because higher yields often improve net interest margins. Insurance companies can benefit because they invest massive pools of capital into bonds. Resource companies can outperform if yields are rising due to stronger nominal growth and inflation pressures. Energy and cyclical sectors, including miners, also tend to be beneficiaries.
The key takeaway is not to panic, it's about positioning. This is increasingly becoming a stock picker's market, where individual stock selection makes the difference between a flat portfolio and a profitable one.
ASX Stocks to Watch in a Rising Yield Environment
Pinnacle Investment Management Group (PNI)
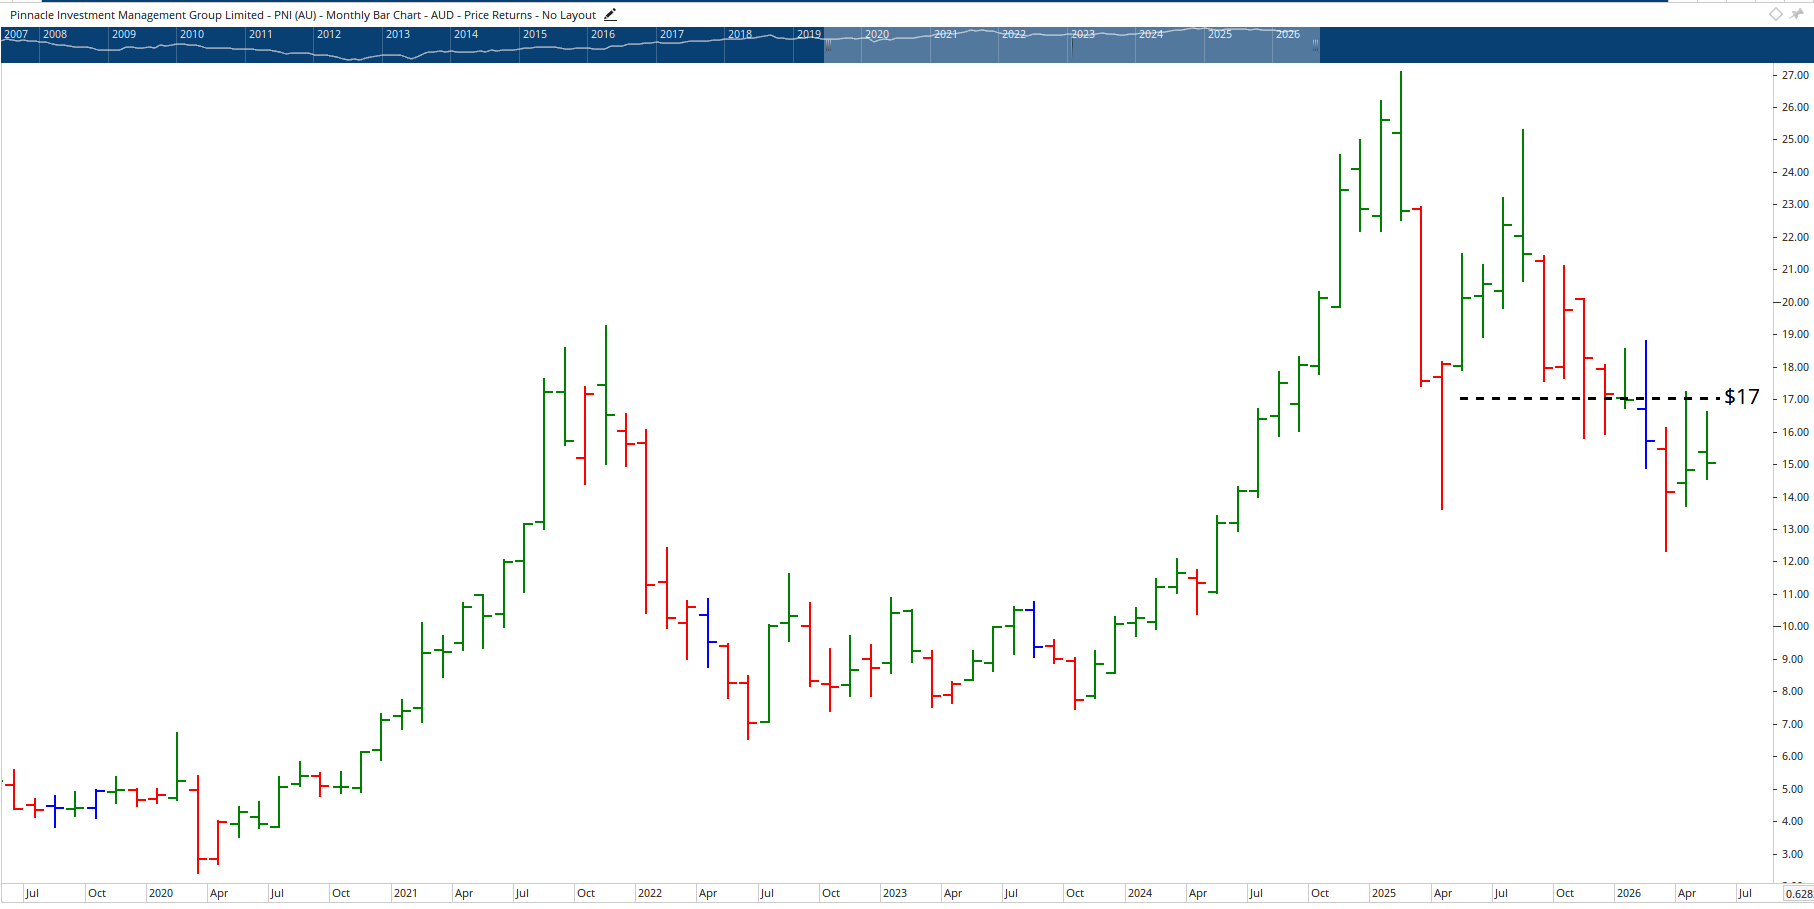
Pinnacle is an asset manager that benefits from higher market volatility and increased demand for active investment strategies during macro uncertainty. The stock is highly cyclical, with peaks roughly every three to four years.
It currently looks to be setting up better than it did during its last decline. A nice consolidation is unfolding, and if it can push back through $17, it has the potential to take off. The April 2026 low is the level to watch.
Netwealth Group (NWL)
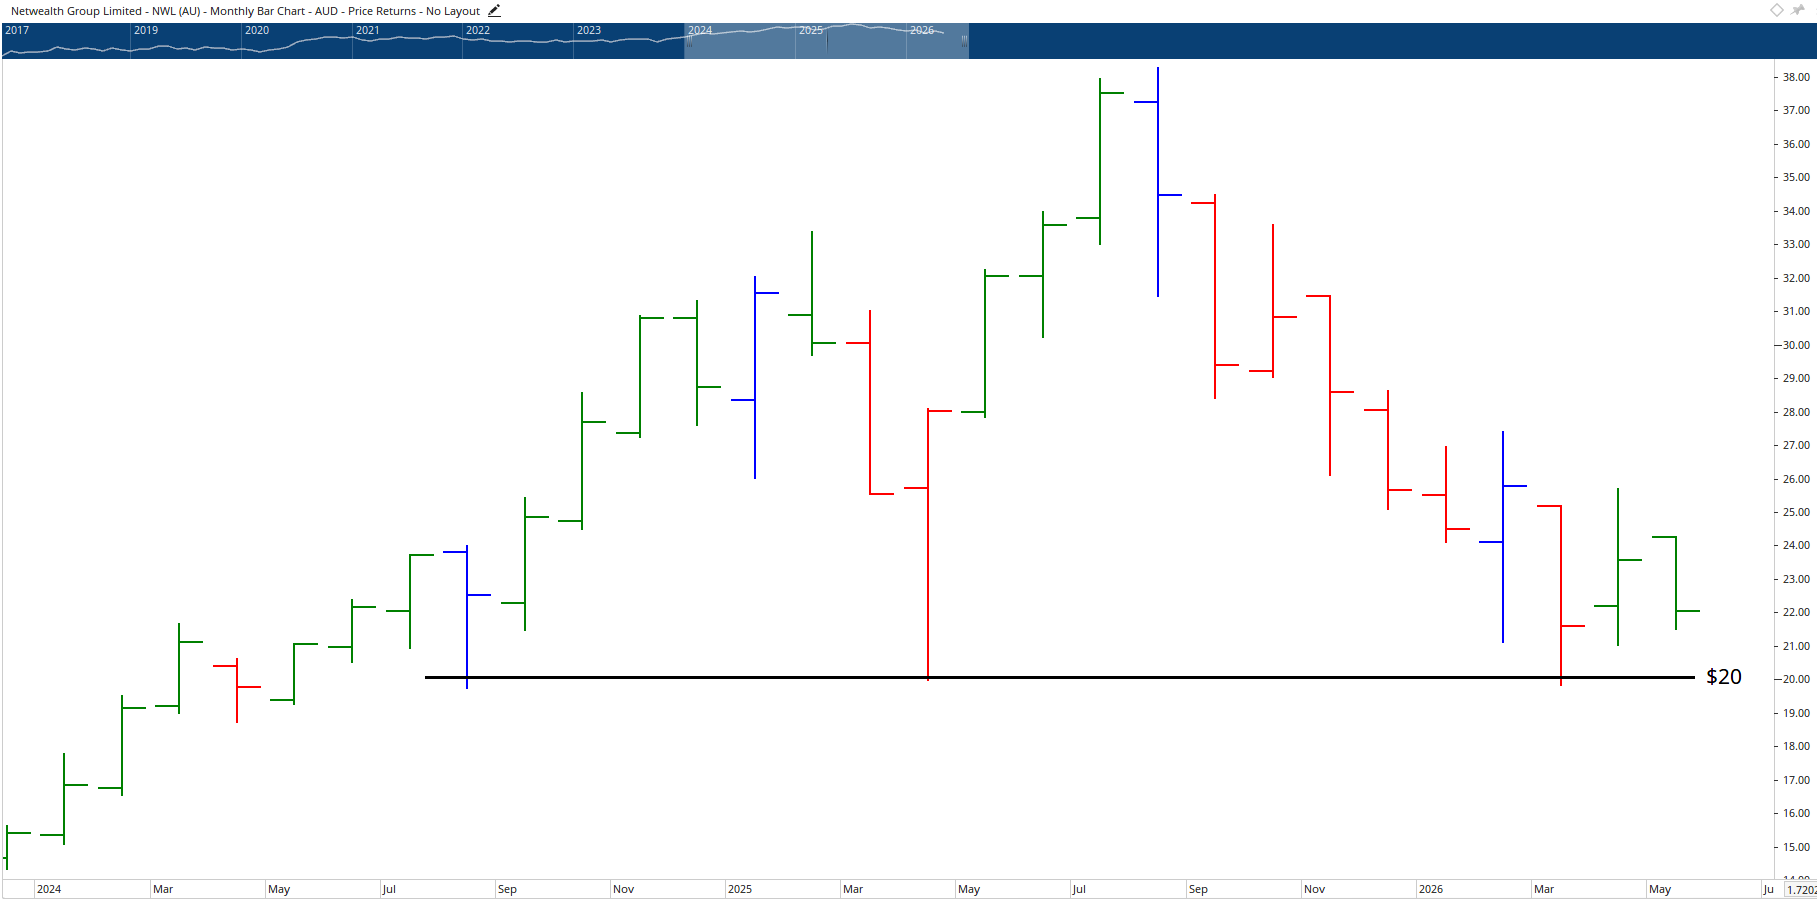
This wealth platform earns higher interest income on client cash balances when rates remain elevated. It has come back to a previous all-time high level, which could provide strong support. Momentum is currently down, with the stock having fallen around 48 to 50%. Watch for a break of that downward momentum and confirmation that the prior $20 low holds before considering an entry.
QBE Insurance Group (QBE)
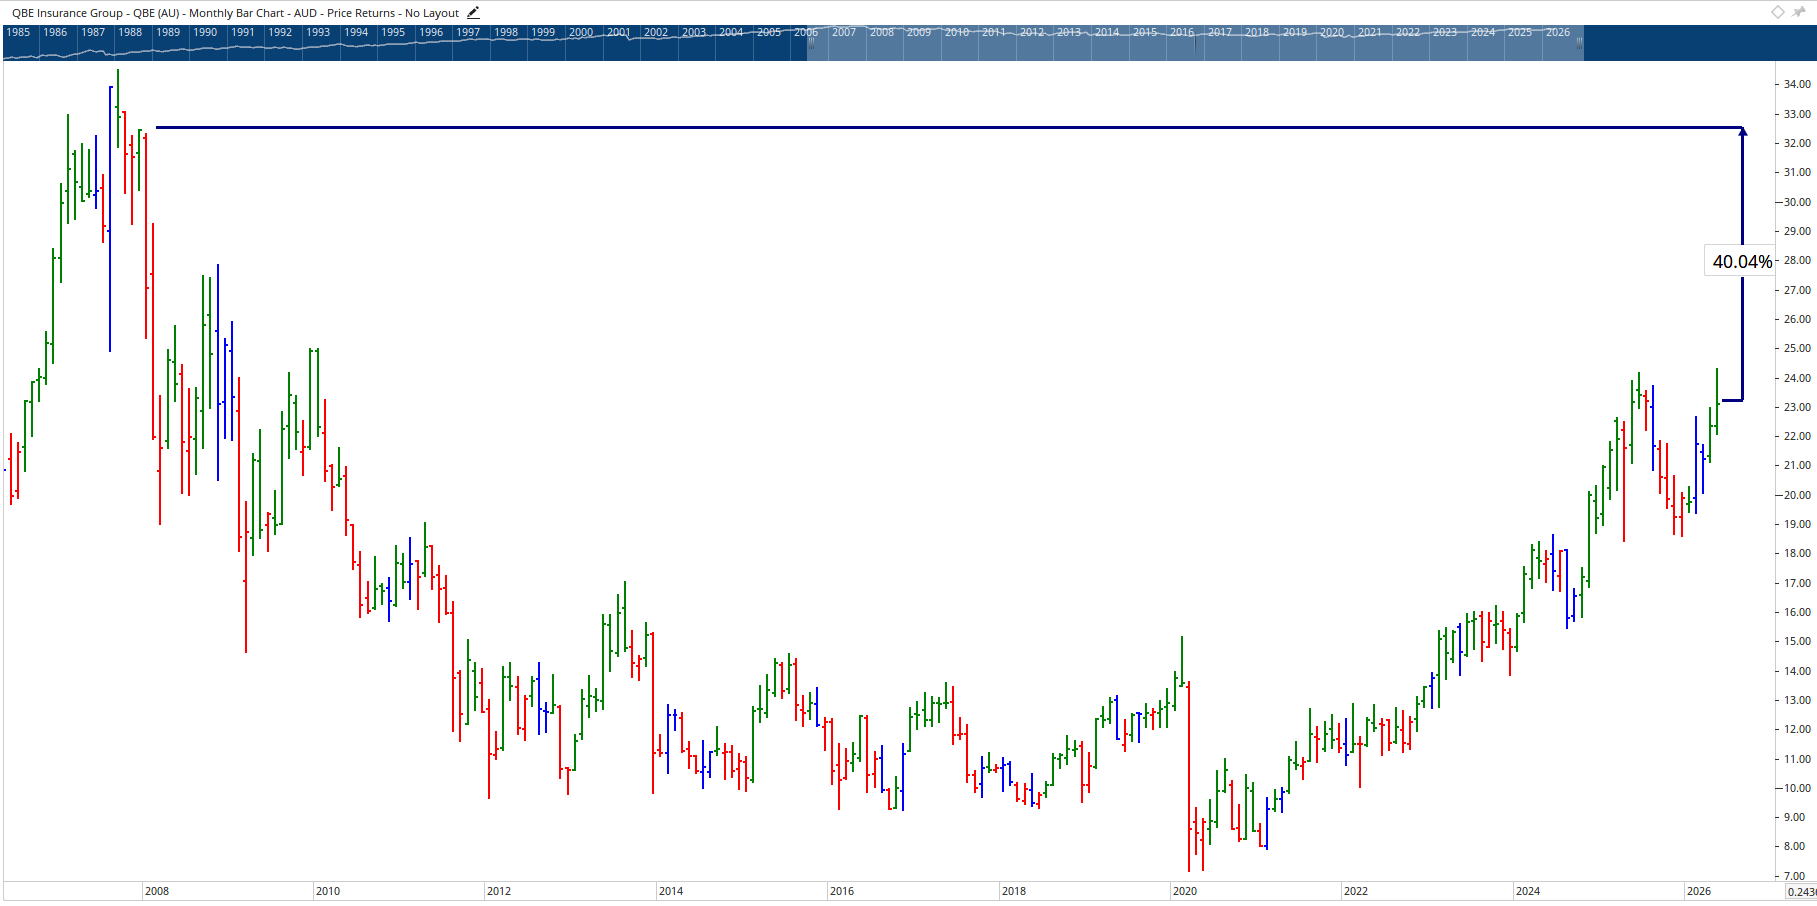
Insurers typically benefit from rising bond yields because they invest large pools of capital into fixed income assets. QBE has been on a steady trend higher and pulled back around 23%, before moving up to challenge that high again. Looking at the long-term chart, there is potentially around 40% upside still to come.
Austal (ASB)
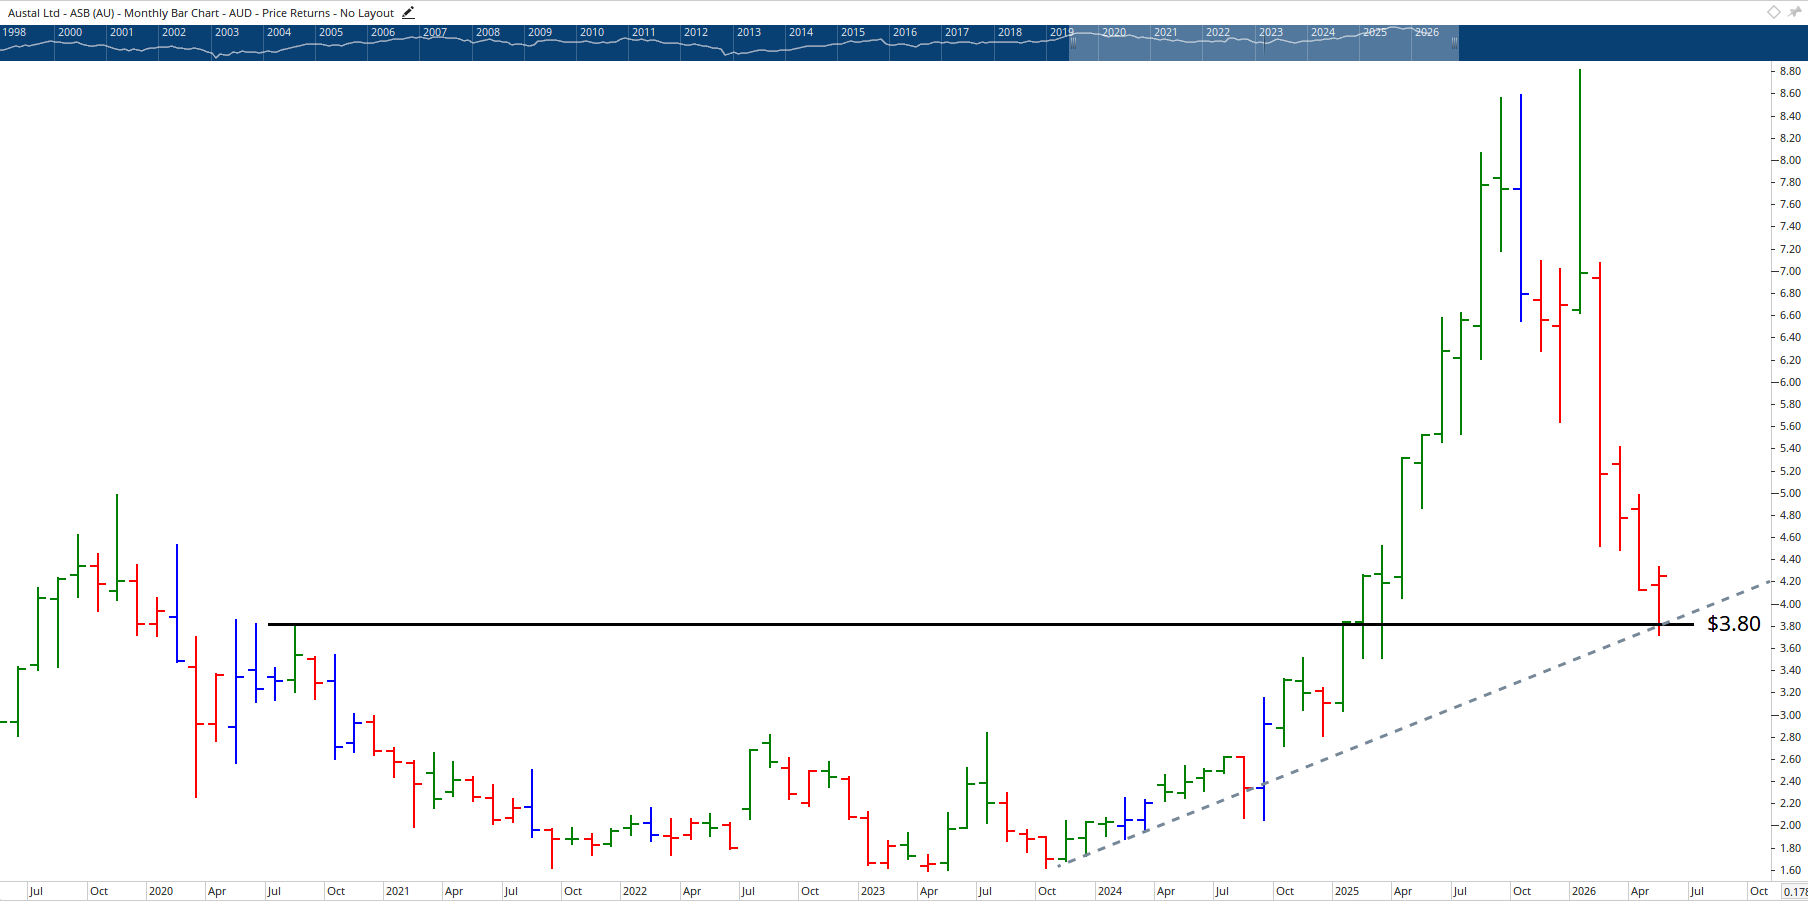
Austal is a shipbuilder leveraged to defence shipbuilding capital flows, as well as rising global defence and infrastructure spending, which often continues during inflationary environments. There are early signs of a possible reversal on the weekly chart, with the stock opening low and closing higher. The $3.80 level is critical, having been an important resistance and support level back in 2020.
SGH Limited (SGH)
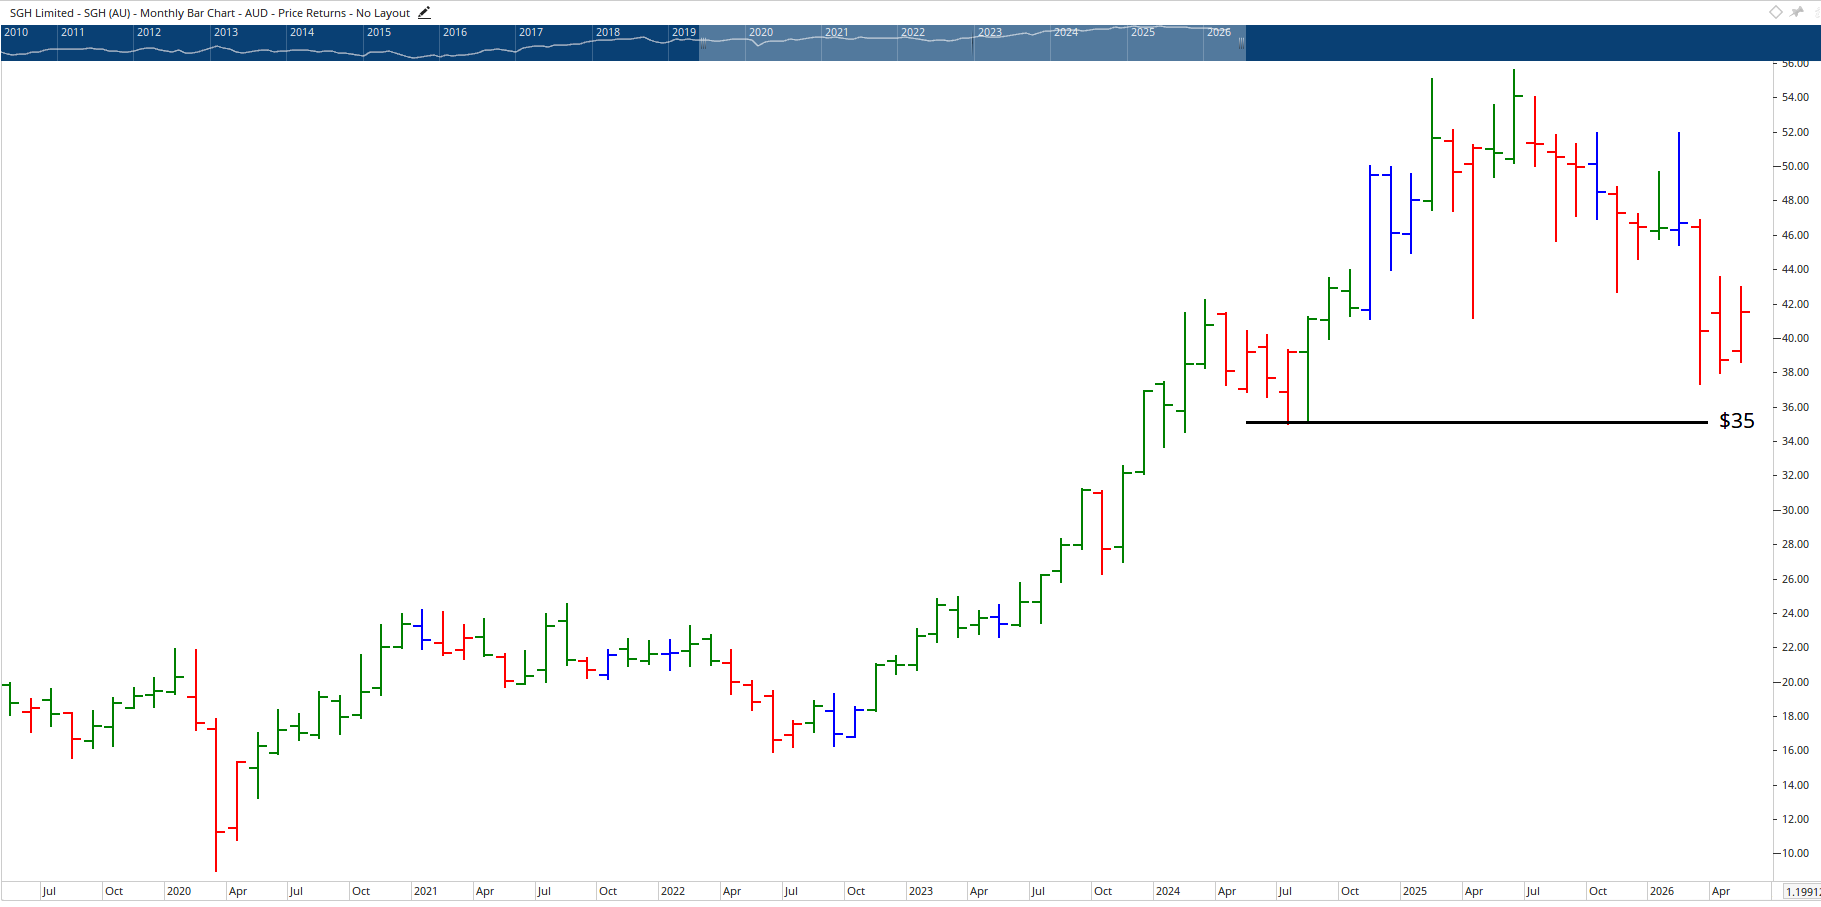
SGH is a diversified industrial and mining services business with exposure to infrastructure, energy and resource spending, three key areas set to benefit from inflation. The stock is in a long-established uptrend and recently found support around $35. A break to the upside on volume could signal the next leg higher.
Capstone Copper (CSC)
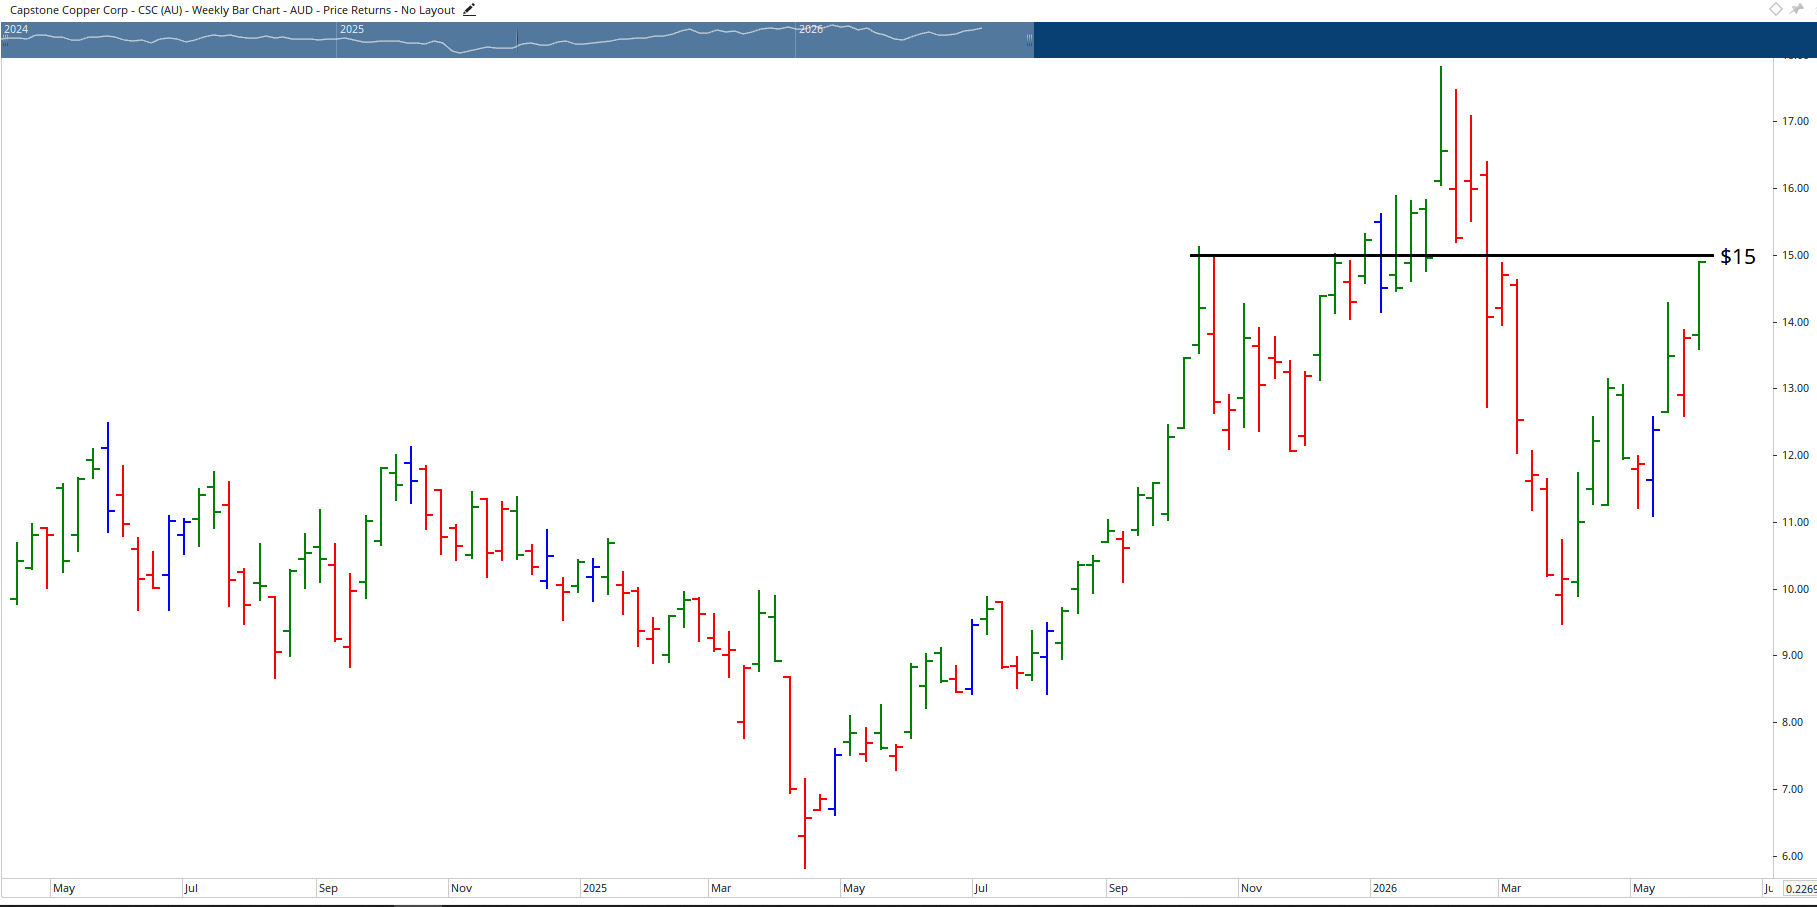
Copper is positioned well to benefit from infrastructure investment, electrification and ongoing commodity demand. As inflation comes in, commodity prices should rise. The stock has had its flush out and looks to be in the next leg up, having made a higher high after a pullback. A clean break above $15 would confirm the move.
Sandfire Resources (SFR)
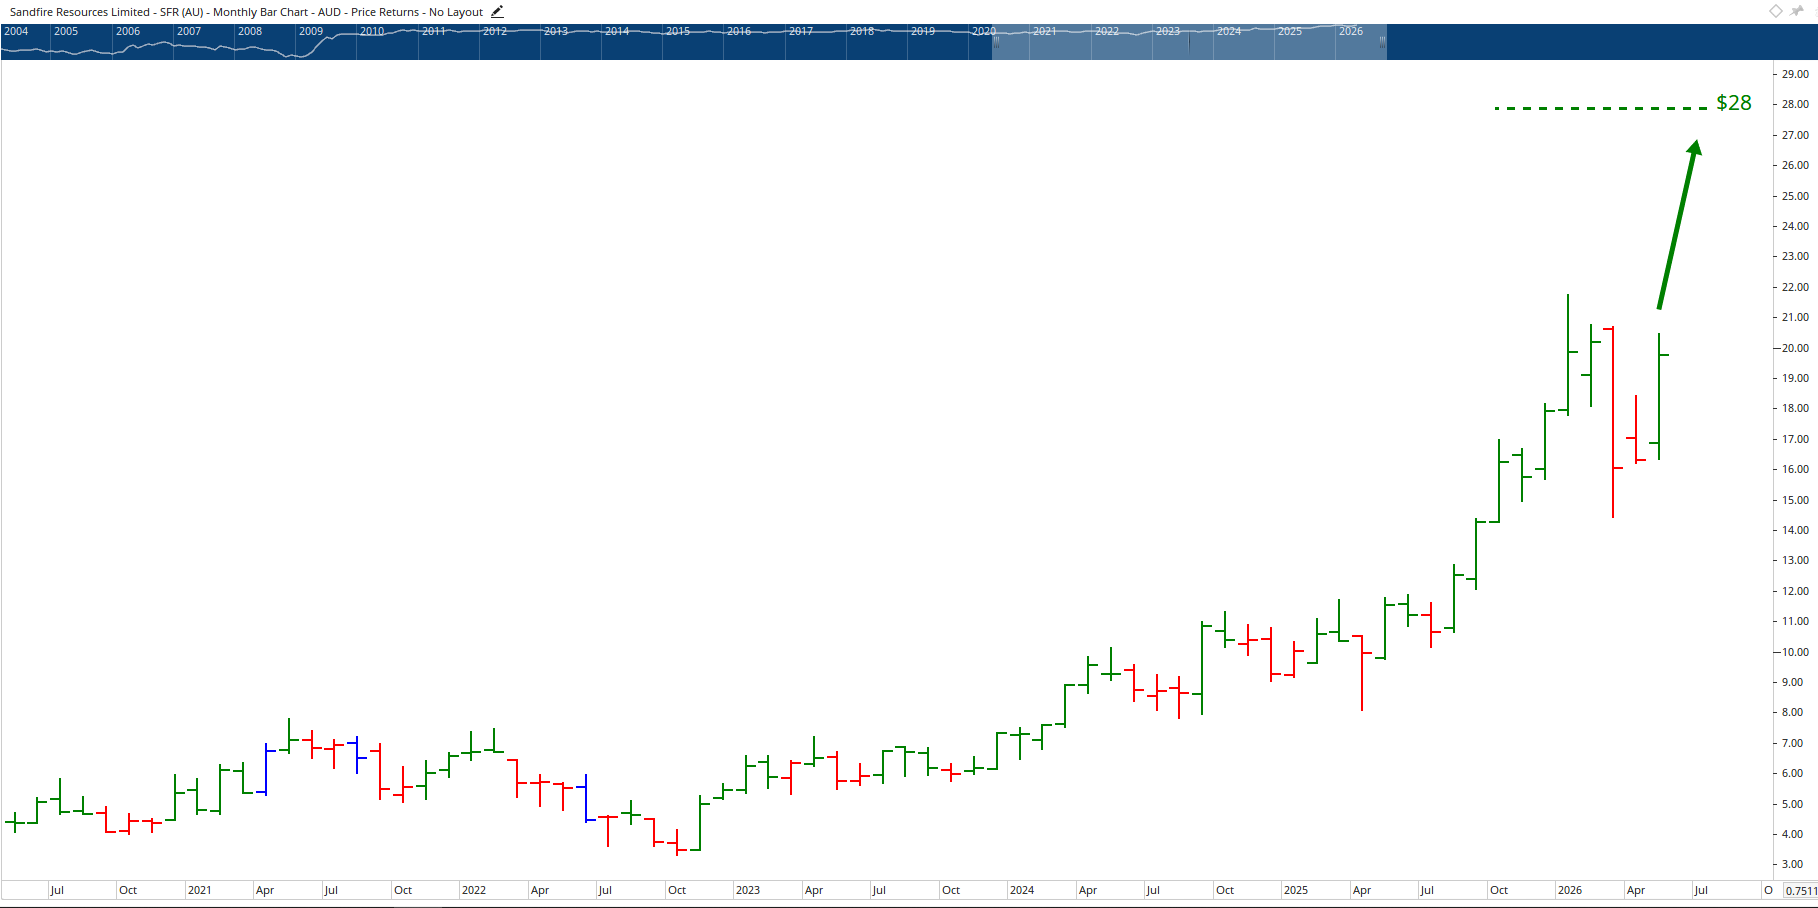
Sandfire previously delivered a 1,671% rise off a sideways consolidation. After another consolidation followed by a 163% rise, there could be more upside ahead. If the May 2026 low holds, the stock could realistically push closer to $28 to $30.
National Australia Bank (NAB)
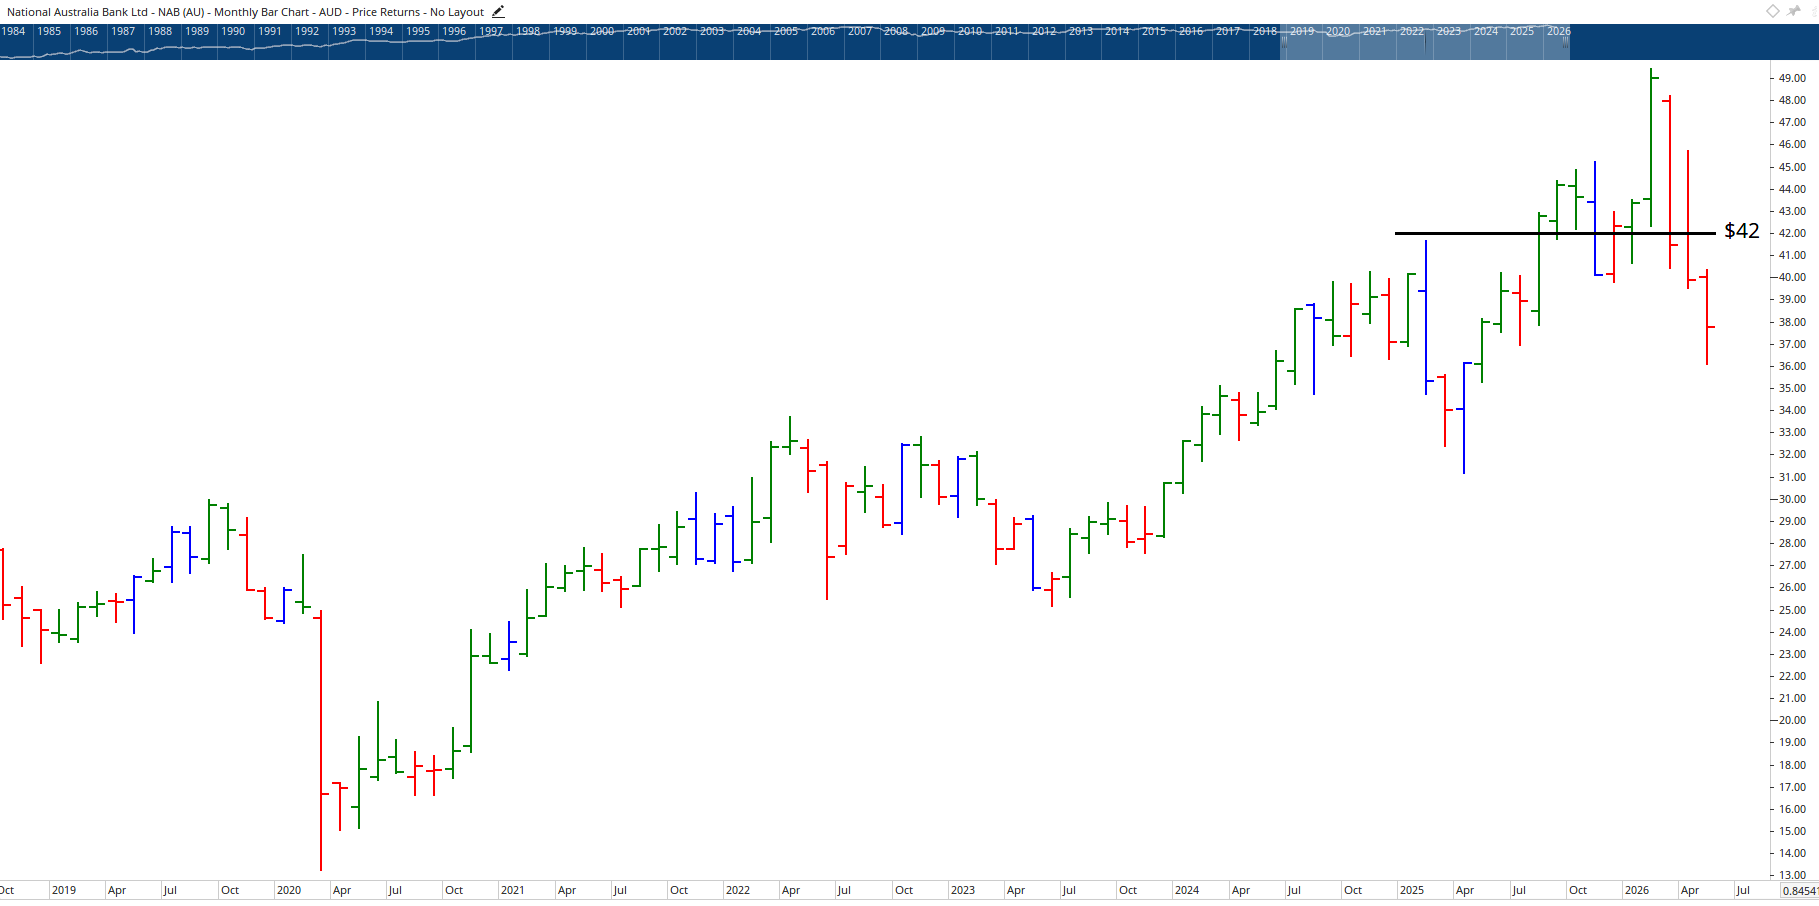
Higher bond yields can improve bank net interest margins and profitability, particularly in business lending. NAB has come back to its overall trend, and that trend has been respected twice already. Volume is starting to increase as price reverses. The stock needs to break $42 to confirm the next move higher.
IGO Limited (IGO)
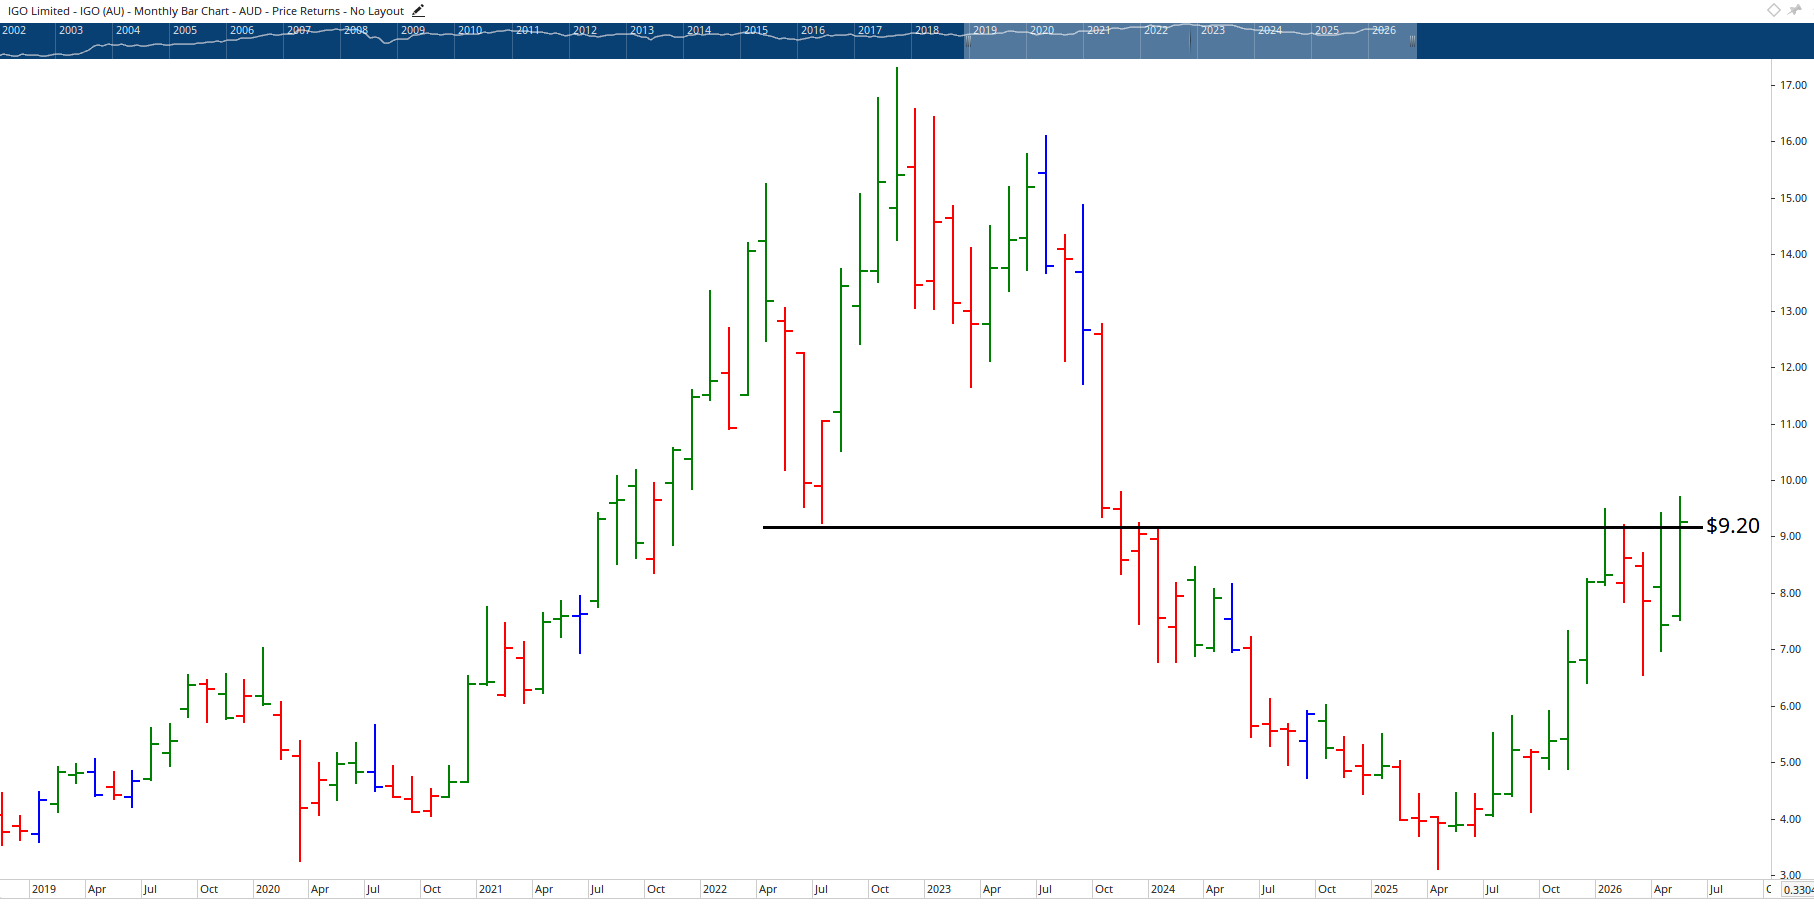
IGO offers exposure to battery metals and long-term electrification trends, supported by infrastructure and energy transition spending. The recent pullback was the test the stock needed, and it is now starting to prove itself this month. Watch the resistance level around $9.20 like a hawk. A clean break could deliver between 20% and 50% upside.
Ventia Services Group (VNT)
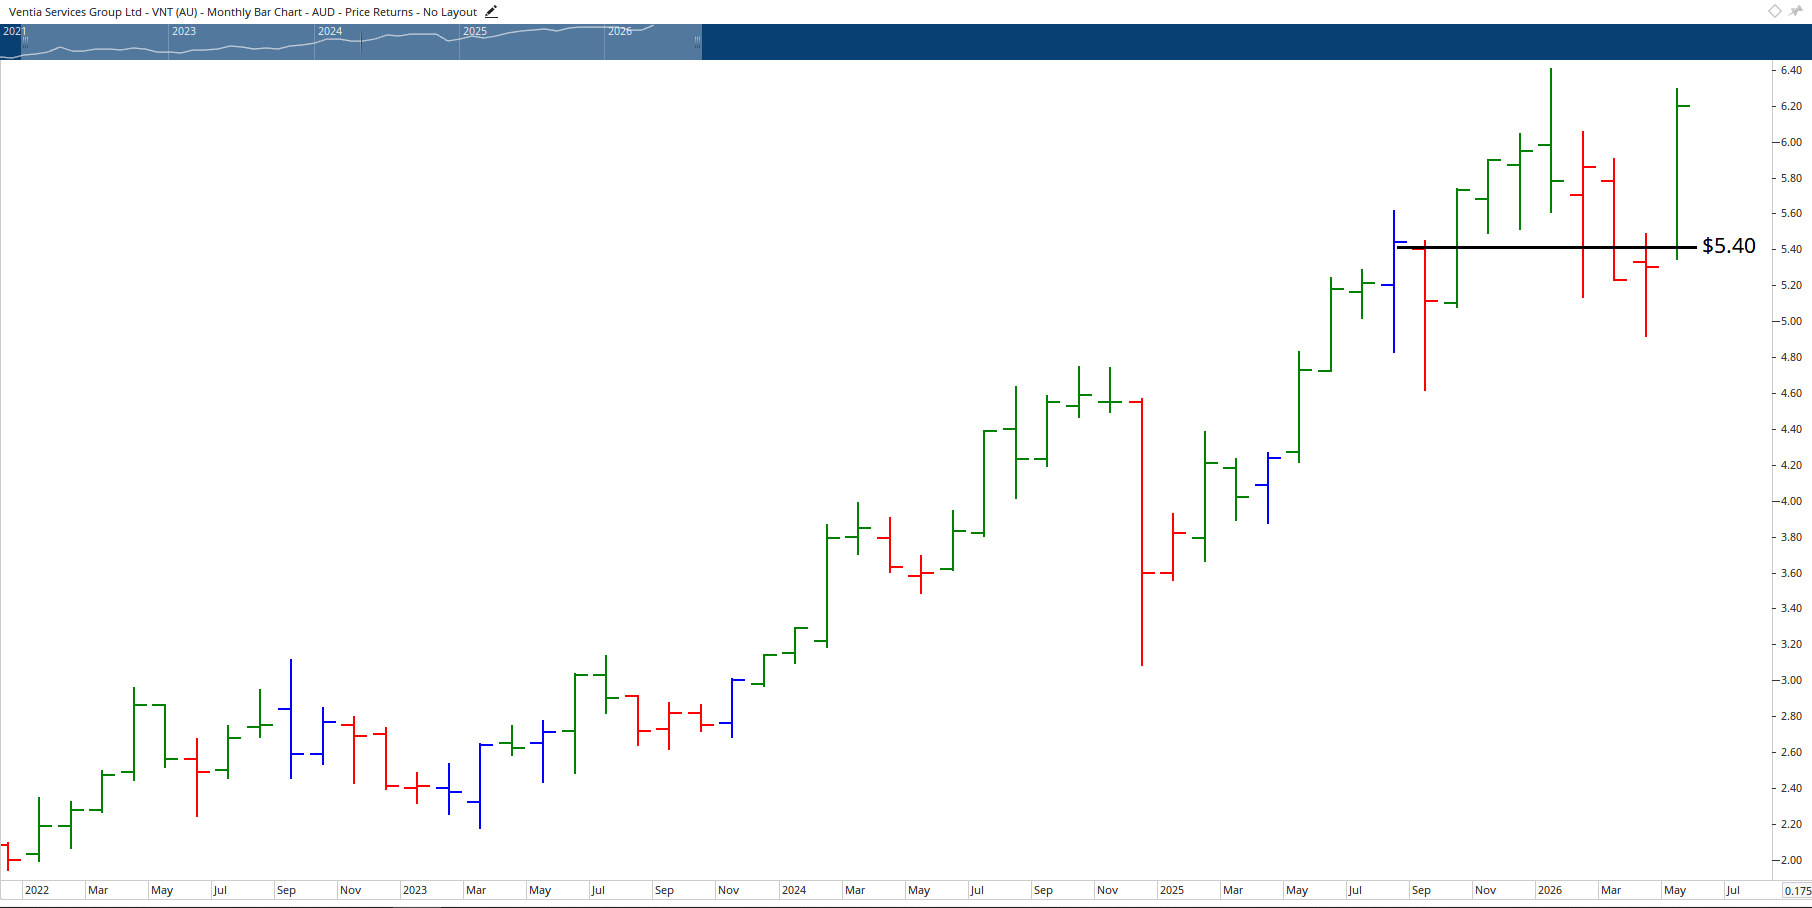
Ventia is a services provider with defensive government and essential services contracts that can remain resilient in volatile markets. Since IPO in 2021, momentum has been clearly to the upside. For short-term traders, a pullback to around $5.40 would offer a more opportune entry. For long-term investors, the trend is your friend.
The Trending Topic: BHP and the Climate Debate
BHP has taken centre stage as debates on climate policy erupt in the iron ore space. Documents obtained exclusively by Four Corners and The Guardian reveal BHP is forecast to cut emissions by just 1% by 2030 for its WA operations, which account for 30% of the company's global emissions.
A BHP memo titled Decarbonisation Plan discussed how delays in adopting electric vehicles powered by renewables would affect the company. According to Clean Energy Finance, BHP is the biggest beneficiary of government rebates on diesel, making fossil fuels cheaper.
Fortescue's Andrew Forrest wants a cap on diesel tax rebates, with Fortescue planning to spend roughly $6 billion from 2023 to 2029 to reach real zero emissions.
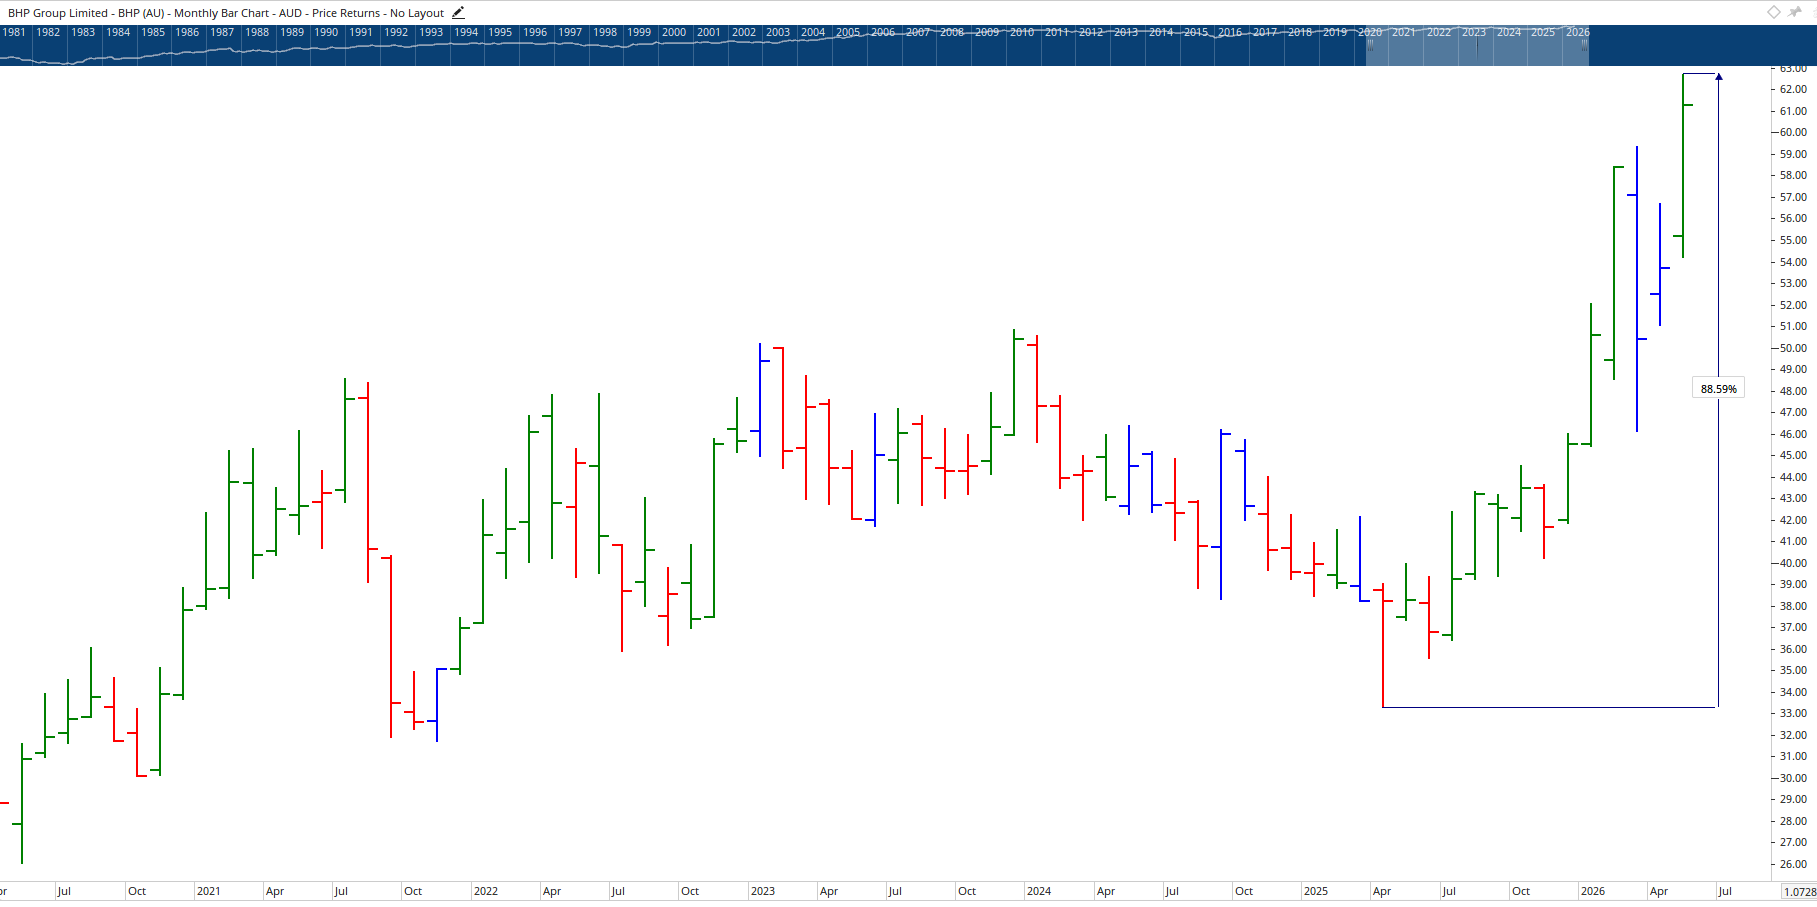
From a chart perspective, BHP has finally broken out of a four-year sideways range. Given BHP's history, this is a significant move. Prior to the GFC, BHP rose nearly 400%, and from its 2016 low, it rose roughly 300% to its peak. The current rise has already delivered 90% and could go further. Knowing when to sell BHP is critical right now, as mining stocks have historically charged to the top before every major market crunch.
Viewer Questions: Lessons in Risk Management
One viewer wrote in with a painful story. He intended to place an order for $25,000 worth of EDV shares but accidentally bought 25,000 shares at $4.93 each. He is now down approximately $45,000 and asked whether he should double down to dollar cost average his position.
The answer is a clear no. Adding more capital to a falling stock with no technical signs of recovery is a disaster from a risk management perspective. The first rule when placing any trade is to immediately check your contract note against your intended trade. If it's wrong, reverse it straight away.
The bigger lesson here is the importance of having a defined risk plan before you enter any trade. You must decide how much you are willing to risk from the outset, place a stop loss, and stick to it. Hoping a stock recovers is not a strategy.
For comparison, AMP fell more than 80% from its listing high. Sitting in hope is not the same as having a plan. EDV could find support around $3, but until the stock breaks above its recent April high, there's no technical evidence the decline is over.
The Hot Stock: Kogan.com (KGN)
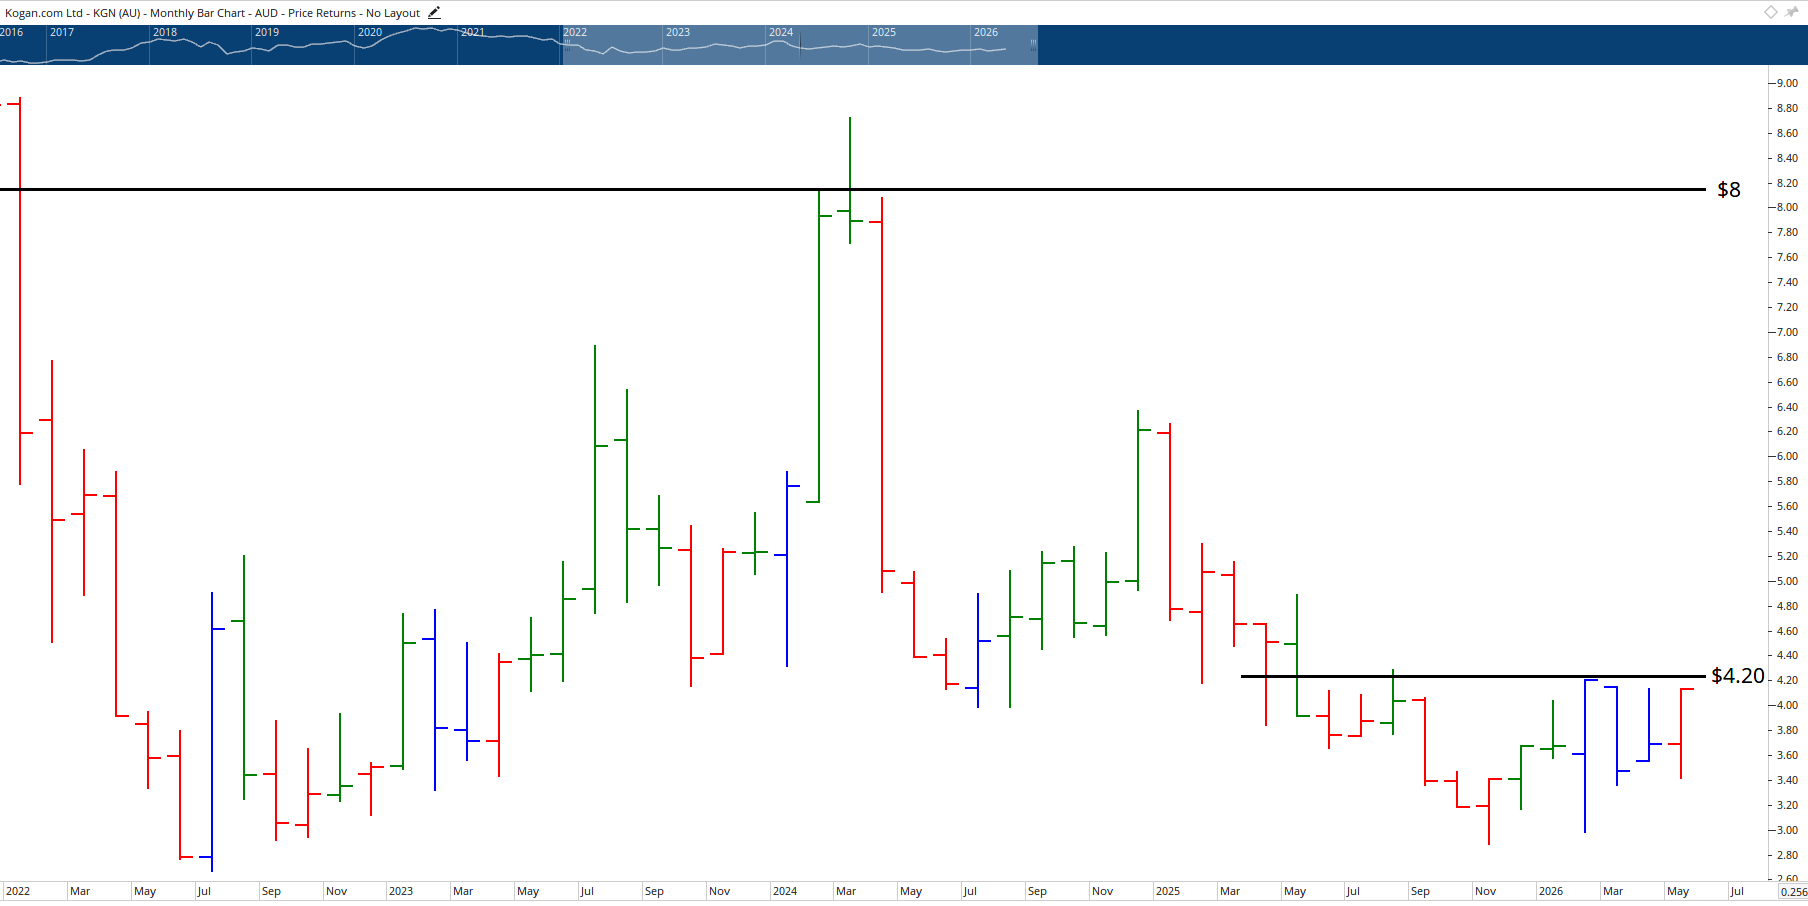
Kogan.com released a strong business update with gross sales growth accelerating more than 24%, while profitability continued improving across the core business. Management said the company is tracking towards the top end of FY26 guidance as margins improve and the Mighty Ape turnaround gains traction. Continued share buybacks signal confidence in the outlook.
The stock jumped 18% on volume following the report. The $3 level has acted as critical support multiple times since 2018, including during COVID, after the 2022 run, in November 2025 and again in February 2026. A more conservative entry would be to wait for a break above $4.20. If history repeats, there is potential for the stock to push as high as $8, levels that previously acted as support.
Final Thoughts: Become a Selective Stock Picker
Markets shift. Conditions change. Without the right skills, traders leave their results to chance. Right now, it's no longer about buying entire sectors or markets, it's about being highly selective with individual stock choices and using a structured set of rules.
Rising bond yields don't automatically mean it's time to sell everything. They mean it's time to position smarter, focus on quality, and manage risk with precision.
If you want to learn how to identify these opportunities yourself, Wealth Within offers a range of trading courses. For those new to the market, the Short Course in Share Trading is a great starting point.
If you're serious about becoming consistently profitable, the Diploma of Share Trading and Investment provides the complete five-step approach. To find out more about who we are and our mission, visit About Wealth Within.
Knowing when to sell is more important than ever. Make sure you have the skills to keep what you've made and grow it through the next phase of the market.
Disclaimer: This article is general in nature and does not constitute personal financial advice. Always conduct your own research or consult a licensed adviser before making investment decisions.