Are CBA and the Big ASX Banks About to Crash?

By Fil Tortevski and Pedro Banales
Reading Time: 8 minutes
Australia’s big four banks are sitting at an interesting crossroads.
Housing prices are weakening, mortgage pressure is increasing, and some bank valuations remain stretched. Yet these are also four of the largest, most widely held companies on the Australian share market, sitting in countless investment portfolios and superannuation accounts.
So are Commonwealth Bank, ANZ, NAB and Westpac setting up for significantly deeper falls, or is the market approaching an opportunity?
In this week’s Hot Stock Tips Show, Senior Analyst Filip Tortevski and Analyst Pedro Banales examine the price behaviour of all four major banks and the levels that could determine what comes next.
What's putting pressure on Australia's big four banks?
The economic backdrop gives investors good reason to pay attention. CommBank economists expect national dwelling prices to fall around 9 per cent from their peak this cycle, while the Reserve Bank says financial pressure has increased for borrowers.
Around 2 per cent of variable-rate owner-occupier borrowers are currently estimated to have insufficient income to cover both essential expenses and scheduled mortgage repayments, although the RBA stresses that most borrowers remain financially resilient.
None of this automatically means bank shares are about to collapse. What matters now is what the stocks themselves are telling us.
CBA: $150 is becoming the critical level
Commonwealth Bank has been the standout bank stock since the COVID-19 low, but its behaviour over the past few years has been very different from what investors historically expected from a major Australian bank.
Rather than behaving like a relatively steady income stock, CBA accelerated sharply higher, at times resembling the price behaviour we would normally associate with a growth or technology stock. That acceleration matters.
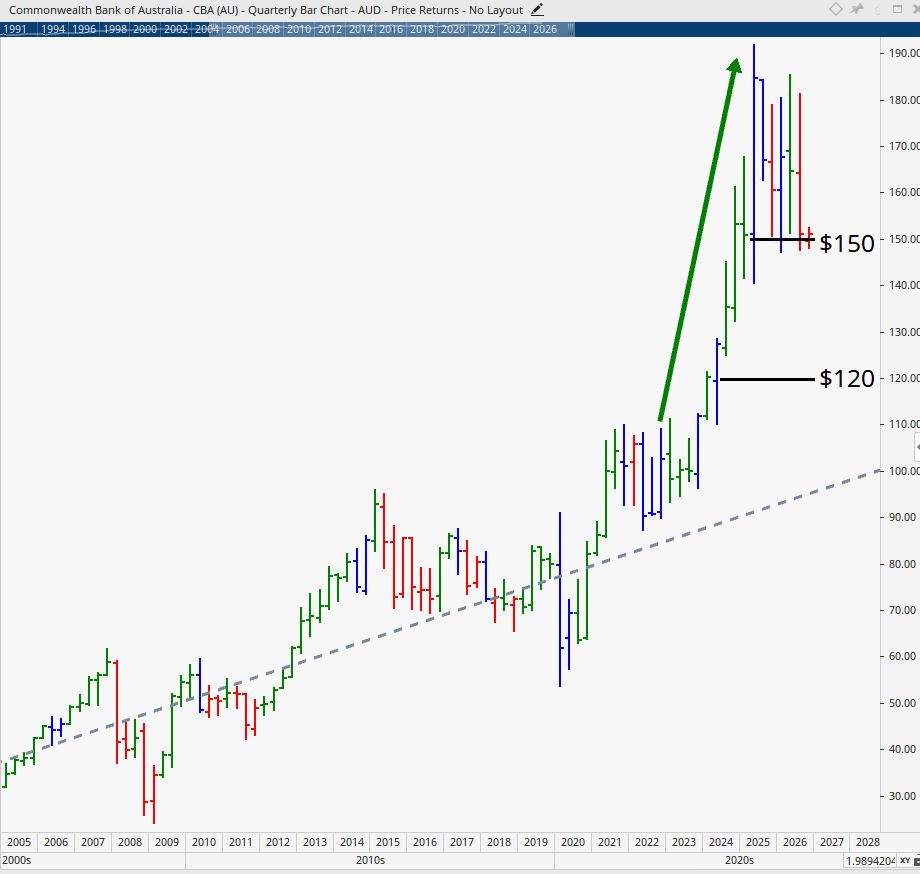
When we step back and examine CBA over its longer history, the share price has repeatedly returned towards its more sustainable long-term rate of rise after becoming significantly extended above it. On the current chart, that longer-term trajectory sits considerably below recent highs.
This creates several important levels.
CBA is currently caught between roughly $150 on the downside and $180 on the upside. The $150 area is particularly important because a decisive failure there would weaken the current structure and increase the probability of a move towards the $120 region.
From there, the longer-term picture raises the possibility of levels closer to $100 if a substantially deeper correction develops. That is not a prediction that CBA must fall to $100. It is an example of identifying where the risk could extend if progressively important support levels fail.
Conversely, if CBA can continue holding around $150, the upper part of its recent range near $180 becomes important again.
Broker expectations are also unusually cautious. Current consensus data puts the average 12-month analyst target at around $125.64, materially below the current market price.
The important point for investors is not whether the brokers will ultimately prove correct. It is that both the fundamental concerns and the technical picture are now highlighting increased risk.
ANZ: Holding up better than CBA
ANZ presents a noticeably stronger picture. Although it also remains well above the longer-term momentum established from the 2020 low, its recent price behaviour has been far more resilient than CBA.
ANZ reached a new all-time high during 2026 after finally breaking above the major peak established more than a decade earlier. Given the strength of that rise, some consolidation is not unexpected. What is encouraging is the way ANZ has handled that consolidation.
Since around July, the stock has largely moved sideways rather than suffering a sharp decline. That can be constructive because it allows time to absorb the previous rise without necessarily surrendering substantial price.
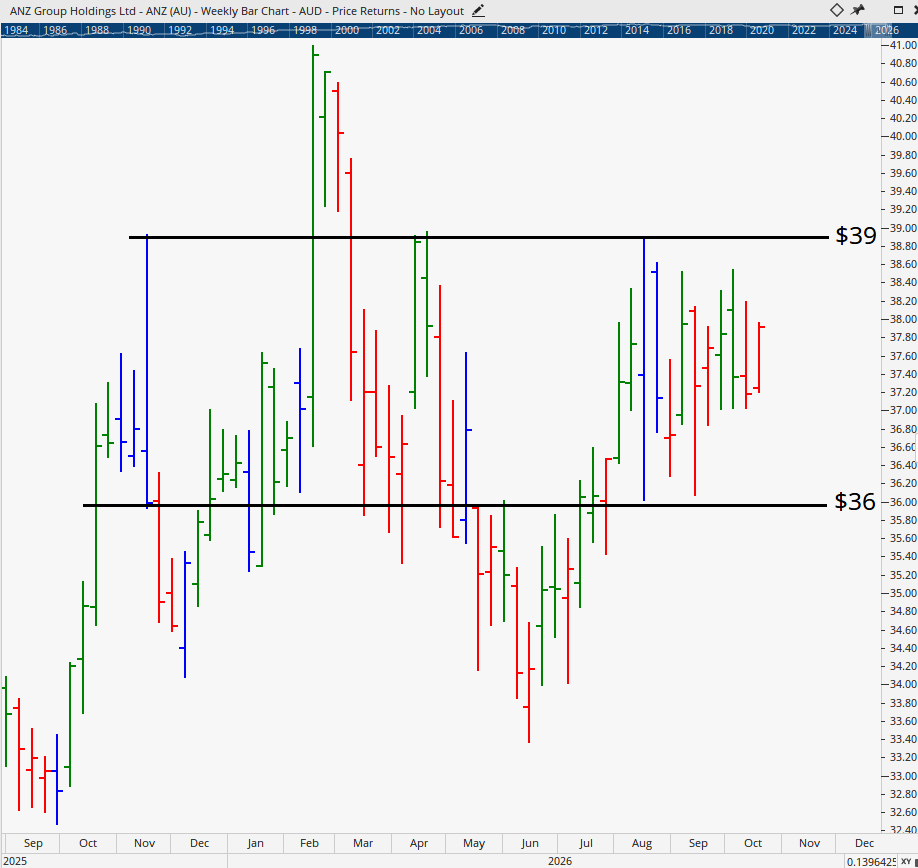
The important range is now approximately $36 to $39. Holding above $36 keeps the stronger structure intact. A break below that area would increase the probability of a decline towards roughly $32.
On the upside, $39 remains the key hurdle. Until ANZ can convincingly move through that level, there is still uncertainty about whether the next substantial move will be higher. This is where patience becomes an analytical advantage.
Rather than trying to anticipate the next move, investors should allow the stock to provide more evidence. If ANZ breaks through the upper boundary, the picture strengthens. If it breaks down through support, the risk profile changes.
That is very different from making a decision simply because the company is one of Australia’s largest banks.
NAB: The sellers still have the upper hand
National Australia Bank is sitting at another particularly important point.
There is one positive feature on the monthly chart: NAB has already pulled back towards the momentum that has supported its advance from the 2020 low. That is healthier than remaining substantially extended above it. The concern comes from the more recent price action.
During previous stages of NAB’s post-2020 rise, the stock was able to push through to progressively higher peaks. The latest rally failed to achieve that. That loss of momentum deserves attention.
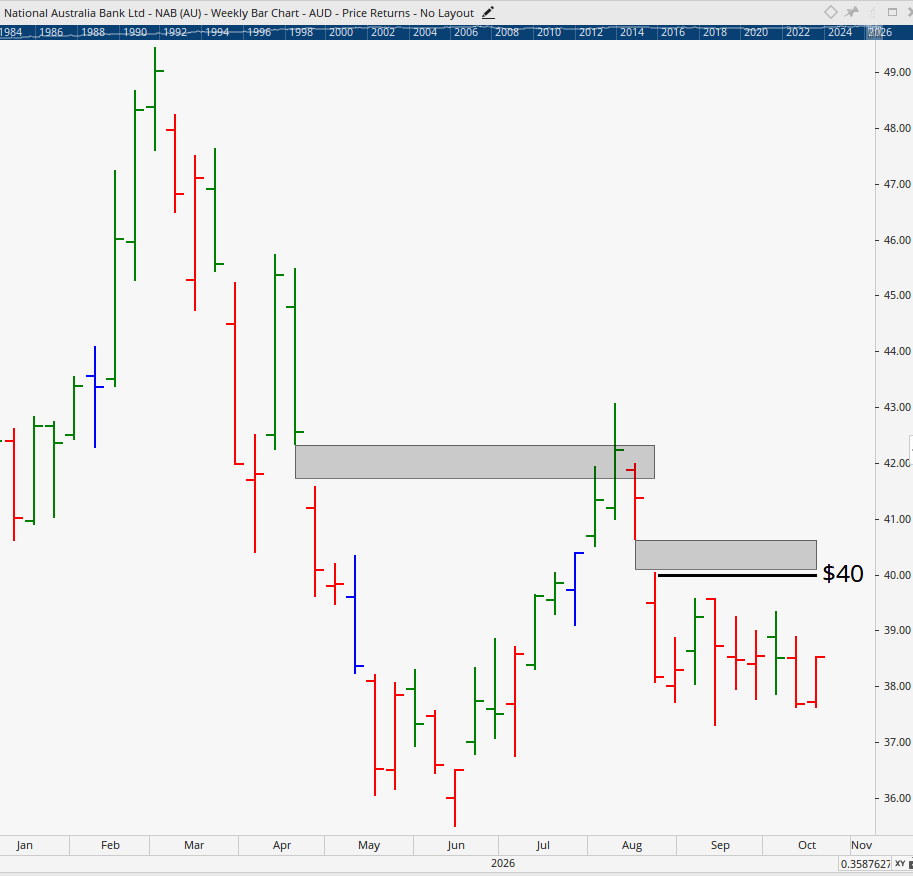
On the weekly chart, the recent declines have also been sharper than the recoveries. Put simply, the selling pressure has been more forceful than the buying pressure. We are also watching gaps created during the decline.
The first significant gap was later tested by the market, providing useful information about where sellers were prepared to return. Another gap appeared during September, and that now gives us an additional area to watch.
If NAB rallies towards roughly $40.50 to $41 and then fails again, it would strengthen the case that the medium-term decline has further to run. A break beneath the longer-term momentum could then open the way towards approximately $31 to $32.
The alternative is equally important. If NAB can overcome the gap, hold above it and eventually push through approximately $42, we would have much stronger evidence that the correction has turned a corner. Right now, however, the balance of the recent price action still warrants caution.
Westpac: History shows why buy and hold can be dangerous
Westpac provides perhaps the clearest example of why investors should not assume that a major bank can simply be bought and forgotten.
Historically, Westpac has experienced some very substantial declines. During the Global Financial Crisis, the stock fell by around half. From its 2015 peak through to the 2020 low, the decline was even larger, at roughly two-thirds of its value. That five-year period is particularly instructive.
An investor could have continued receiving dividends throughout the decline, but those dividends would not have compensated for the destruction of capital caused by such a large fall in the share price. That is why dividend yield alone cannot substitute for managing risk.
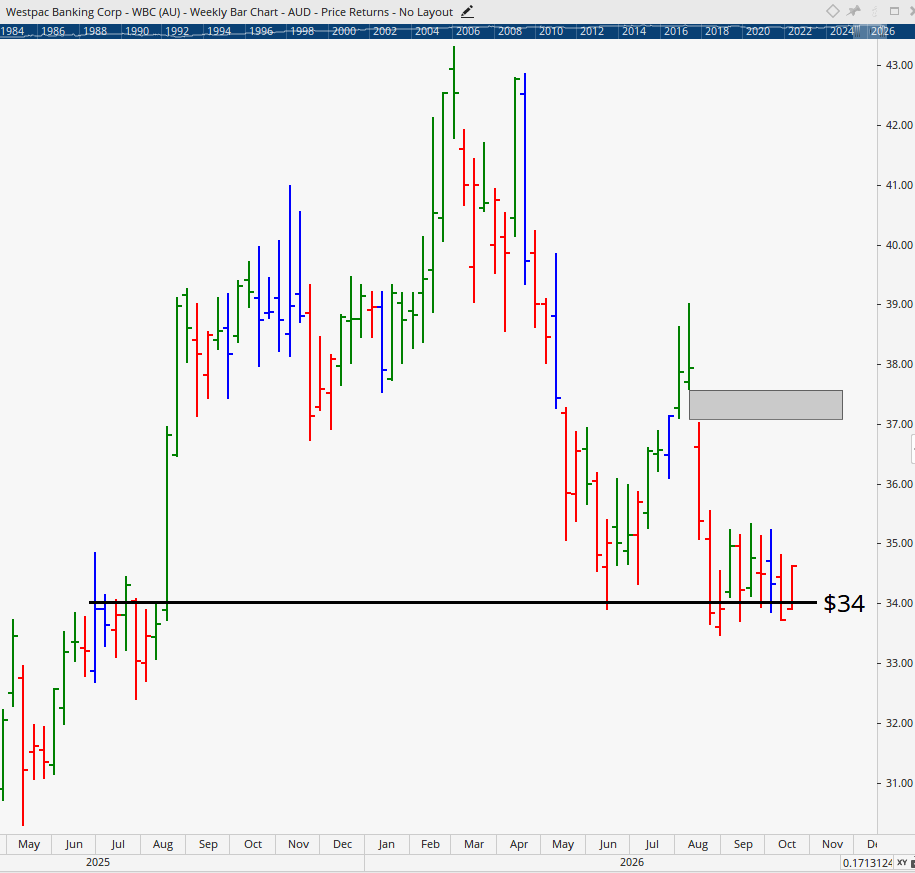
Westpac has already fallen considerably from its recent high, but historically that does not mean the decline must be over. The stock has broken a shorter-term momentum line established from 2023 and is now hovering around another important support area.
For the immediate picture, roughly $33 to $34 needs to hold. If it does, there is potential for a shorter-term recovery, including a move back towards an overhead gap on the weekly chart.
But that possibility alone is not enough. Confirmation matters. If Westpac cannot hold the $33 to $34 region, the longer-term structure leaves open the possibility of a move towards approximately $30 and potentially lower levels if a more substantial correction unfolds.
This is why buying purely because a stock has already fallen can be dangerous. A stock being cheaper than it was several months ago tells you very little about whether the decline has finished.
The common lesson: Let the market confirm the direction
The most striking feature across the four banks is that none is currently giving investors an entirely clear long-term signal.
CBA is testing major support after a powerful multi-year run. ANZ is holding up considerably better but remains confined within an important range. NAB has already corrected towards longer-term momentum, although recent selling remains dominant. Westpac has fallen sharply and is approaching levels that could determine whether the decline stabilises or deepens.
This is exactly why analysis should not be reduced to labels such as “good company”, “cheap stock” or “high dividend”. The question is what the stock is actually doing.
Strong investors and traders develop rules that allow the evidence to change their view. Support holding can strengthen a case. Support failing can weaken it. A resistance level being broken can alter the probability of what follows.
The objective is not to predict every movement perfectly. It is to recognise when the balance of probability has changed.
Building the skills to make better decisions
The four banks demonstrate several of the core skills we teach at Wealth Within through the government-accredited Diploma of Share Trading and Investment: identifying trend and momentum, recognising important support and resistance levels, comparing buying and selling pressure and understanding how price structure changes through different market cycles.
Those skills give investors something far more useful than simply reacting to headlines. They provide a framework for making more informed decisions. You can also gain an understanding of these skills in Dale Gillham's bestselling book 'How to Beat the Managed Funds by 20%'.
Rather than asking whether somebody else thinks a bank is a buy or a sell, an educated investor can examine the evidence, determine what would confirm or invalidate their view and manage their capital accordingly.
That becomes particularly important during uncertain periods when economic news, broker opinions and market sentiment are all pulling investors in different directions.
Final thoughts
Australia’s major banks are not all telling the same story, but they are all approaching important levels.
CBA needs to defend approximately $150. ANZ needs to resolve the $36 to $39 range. NAB needs to overcome the selling pressure around the low-$40 region, while Westpac needs to establish support around $33 to $34.
If those levels begin failing, the risk of deeper corrections increases. If the stocks instead stabilise and break through their respective resistance levels, the outlook changes.
That is the key lesson. There is no need to guess whether Australia’s banks are about to crash. Let the evidence tell you.
This article provides general information and education only. It does not constitute personal financial advice.