ASX Reporting Season H2 2026: The Stocks and Sectors to Watch
By Janine Cox, Fil Tortevski and Pedro Banales
Reading Time: 8 minutes
General Advice Disclaimer
You acknowledge that the information provided by Wealth Within is intended for general use only and does not take into account your investment objectives, financial situation or advisory needs, nor does the information provided constitute investment advice. For this reason, any individual should consider the appropriateness of the information, having regards to the individual's objectives, financial or taxation situation and needs before acting on this information, and, if necessary, seek appropriate professional advice. In addition, it is important to understand that the risk of investing in the stock market is that you could lose some or all of your money. For more information please refer to our Terms and Conditions.
Ahead of the August 2026 reporting season, investors faced conflicting signals across earnings, interest rates, commodities and consumer spending. With the oil price swinging wildly, inflation metrics shifting, and interest rate decisions changing on a dime, this reporting season could be one of the most consequential in recent memory.
In the latest episode of the Australian Stock Market Show, Senior Analysts Filip Tortevski and Janine Cox were joined by Analyst Pedro Banales to discuss which sectors are poised to lead, which are set to lag, and the individual stocks that could deliver the biggest surprises when results begin rolling out. To learn more about our team, our accreditation, and our two-decade track record of results, visit about Wealth Within.
What Investors Should Expect this Reporting Season
According to UBS, the ASX 200 is expected to deliver its strongest earnings growth in four years, led by a rebound in miners. However, banks are being flagged as facing tougher conditions and may underperform. Consensus forecasts point to 12% earnings per share growth overall, but strip out resources and financials, and that number drops to just 2.5%.
That is not surprising when you consider that financials and materials collectively make up around 58% of the Australian market. If one sector is expected to do well and the other is expected to lag, they largely offset each other. This leaves the door open for other sectors to shine, particularly industrials and utilities, where the key question will be how well companies have passed on rising costs to consumers.
Reporting season always produces surprises, which is exactly why it is such an important window for active investors. Short-term profit takers can enjoy the volatility, while those with a longer view can identify quality companies being mispriced by the market. AI is another key theme, with the rollout across large corporations likely to reveal genuine efficiency gains, although the rising cost of data storage is now emerging as an offsetting concern.
Consumer-facing companies remain under pressure, with households feeling stretched by interest rate concerns. Healthcare is another sector worth watching closely because it has been sold down so heavily that any positive surprise could trigger a meaningful rebound.
The Materials Sector: Still Room to Run
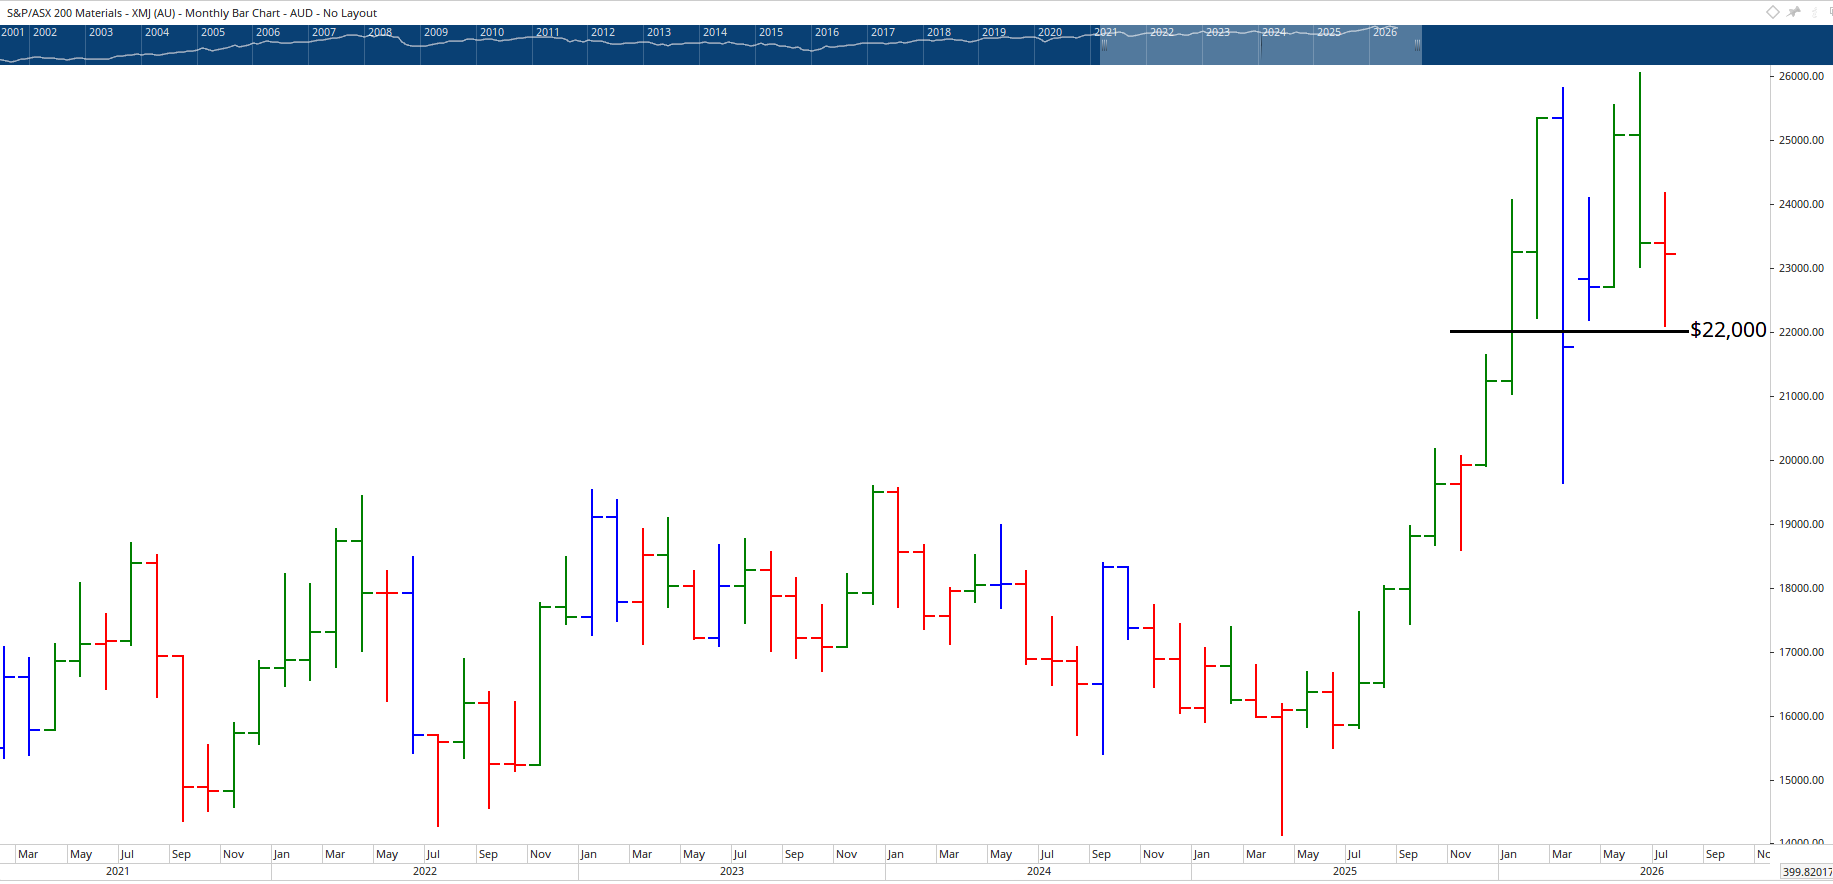
Looking at the monthly and weekly charts of the materials sector, the big picture story is compelling. Since the 2001 low, materials had a spectacular run into the GFC, followed by a long-term bearish move down to the 2016 low. From there, the mining boom drove a long-term bullish outlook, with a period of indecision starting around 2020.
Right now it looks like we have a continuation of that overall long-term trend. The sector appears to range between 22,000 and the all-time high near 26,000. As long as it holds above 22,000, and particularly if it breaks above 25,000 to 26,000, materials could deliver another strong leg up, similar to the sideways consolidation we saw in 2019 before the next move higher.
The Financial Sector: The Potential Wildcard
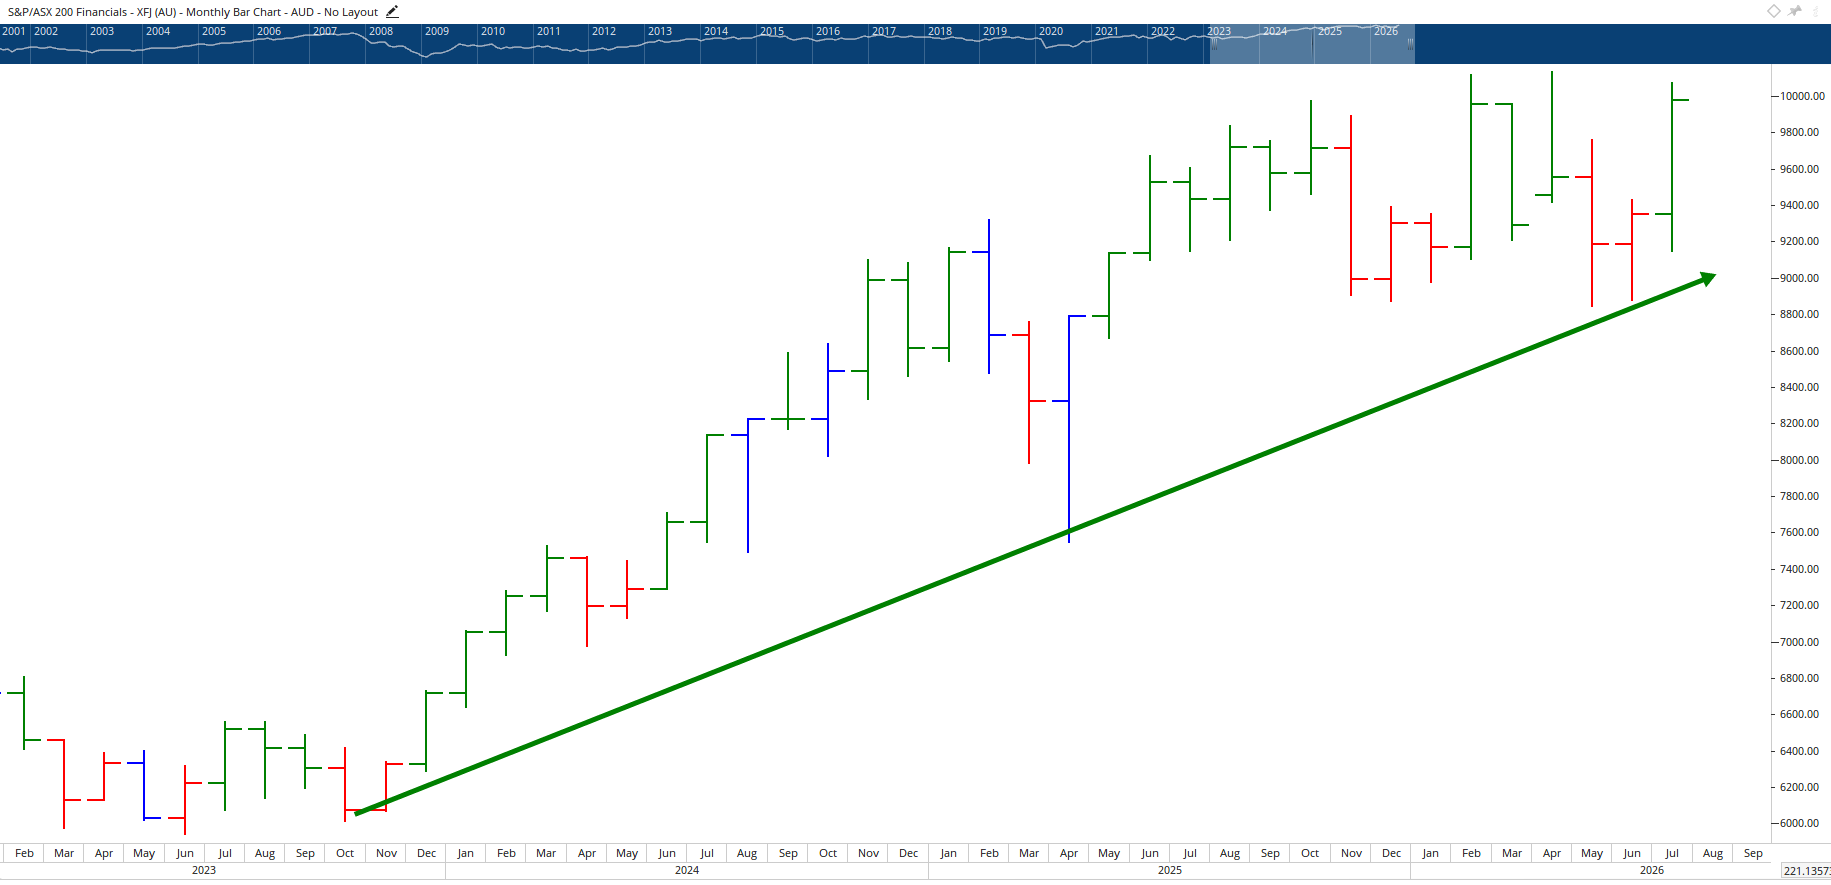
The financial sector tells a similar big picture story with one important difference. After running to the GFC high, financials traded sideways for roughly a decade. You would not have wanted to be a passive holder during that period, although active traders could have extracted returns from individual stocks within the sector.
Now, financials look to be resuming their long-term move, with the momentum well established from the GFC low. As long as the sector holds around its current momentum level, financials could be the real wildcard this reporting season. If banks report better than the market fears, we could see a genuine flight to safety back into the sector.
Retailers: Priced for Bad News?
The retail sector has been battered over the past six months, and this is often where the biggest surprises occur. When negativity is already priced in, even in line results can spark a strong rebound.
JB Hi-Fi (JBH)
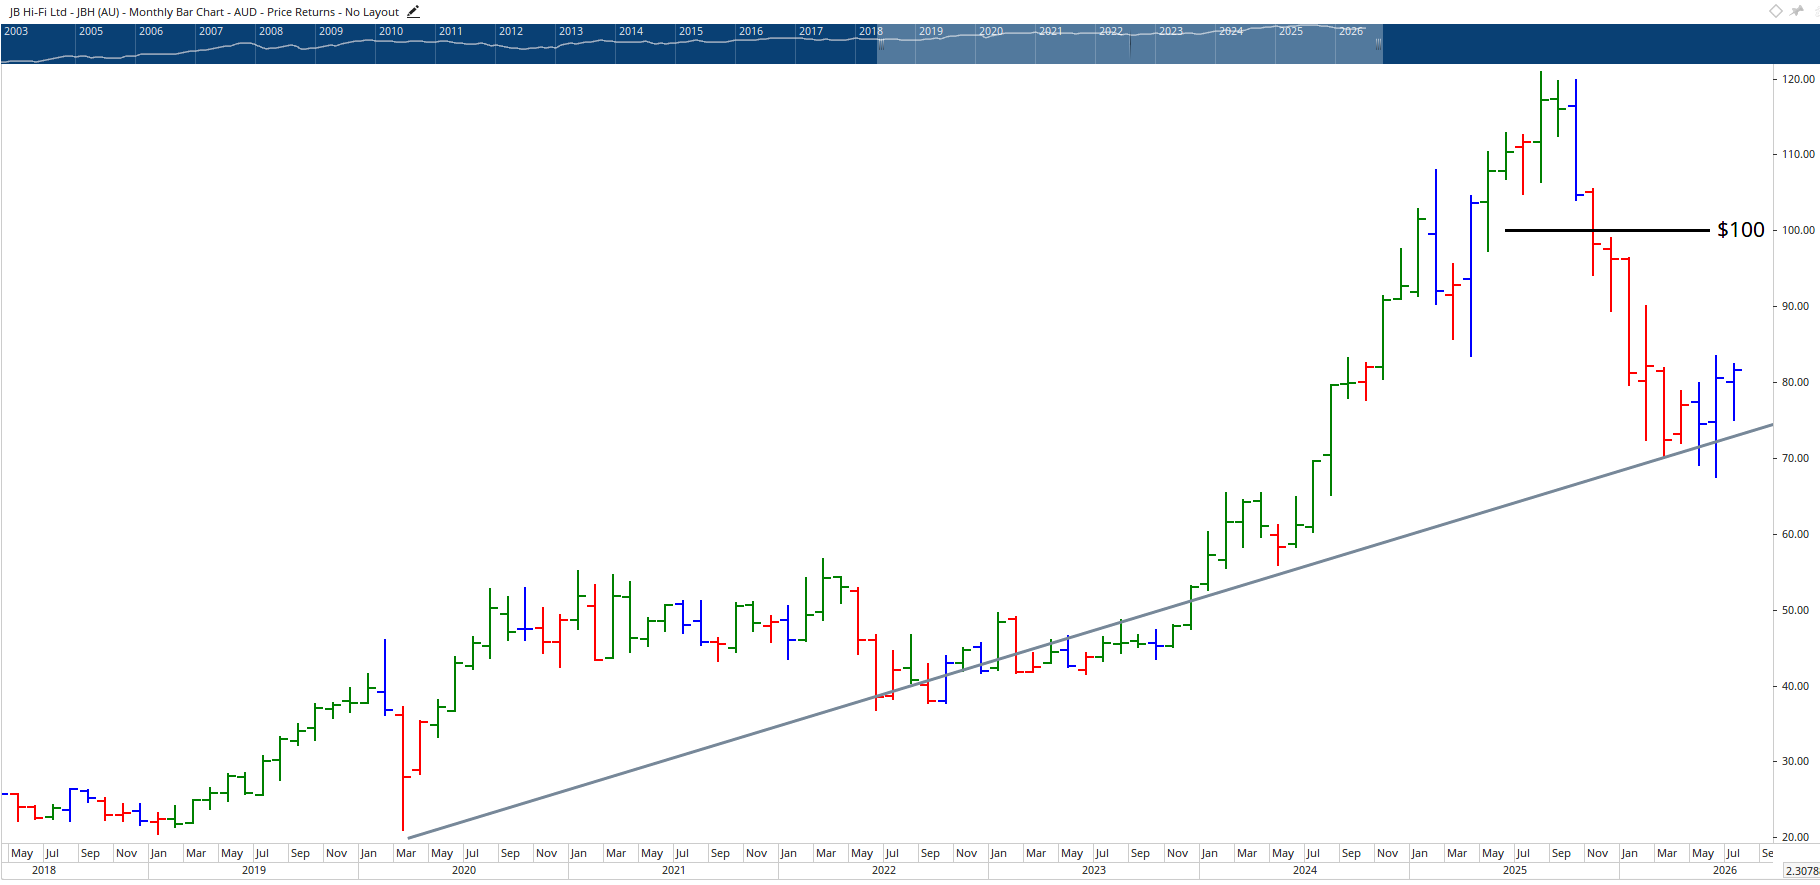
JB Hi-Fi has been heavily sold down, and when sectors or stocks fall 40 to 50%, that is often where they begin moving back up. The angle of momentum has flattened considerably compared to its recent trend. There is potential for a short-term rise and short-term gains, with the stock potentially heading back towards $100 if it clears its early July high. As a well-established brand, the fundamental story remains intact.
Harvey Norman (HVN)
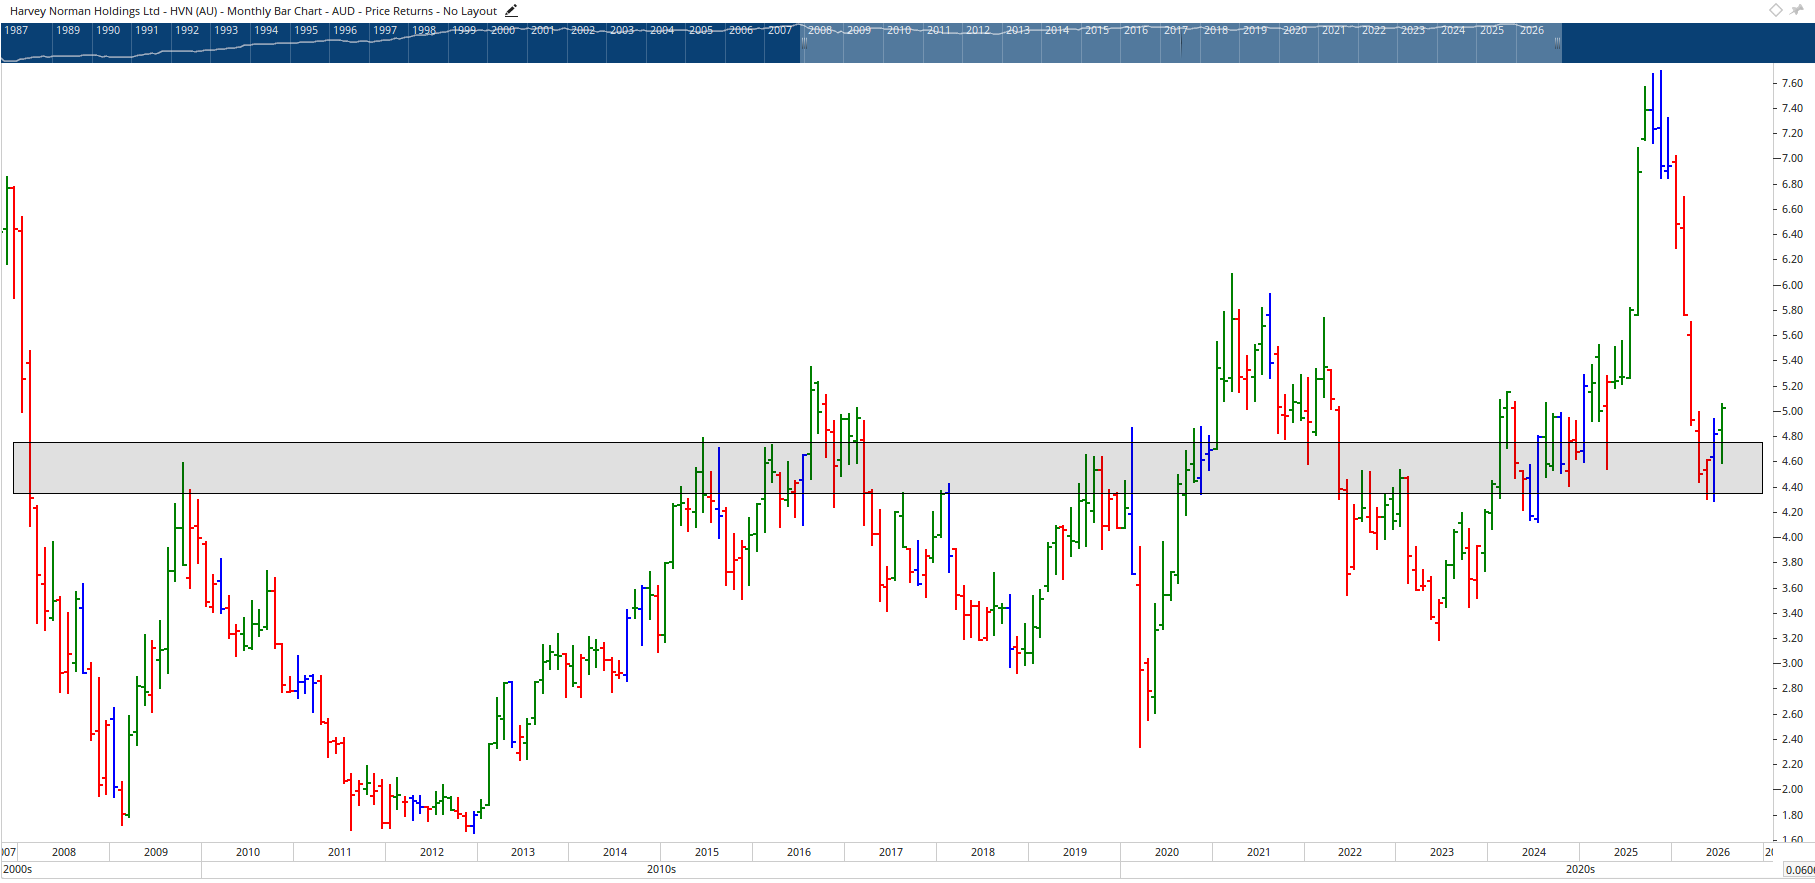
Harvey Norman has come back into a very significant historical price range, with support levels stretching back to 2001, 2007, and the post GFC recovery. These are well-established levels, and after making a new all-time high and pulling back to this same important support zone, an interesting opportunity is setting up. Any move back below the current low would be a signal to sit and wait, but the shorter-term trend suggests the stock is trying to make a move.
Rate Decision Ahead: Where Money is Rotating
The RBA rate decision is just around the corner, with Finder's latest survey showing 55% of economists predicting a rate rise. The likely next move is a rise of 0.25%, sooner rather than later.
But the real opportunity is not in predicting the RBA's decision, it is in identifying where institutional money is flowing. Active investors can use sector rotation to assess where market strength is developing. Initially, banks benefit from a rate hike, but if borrowers are squeezed too far, property prices fall.
Property, consumer discretionary, and technology sectors, particularly companies carrying high debt, tend to be the biggest losers. Healthcare and utilities often benefit, and money rotates to miners where Australian rates have less direct impact on earnings.
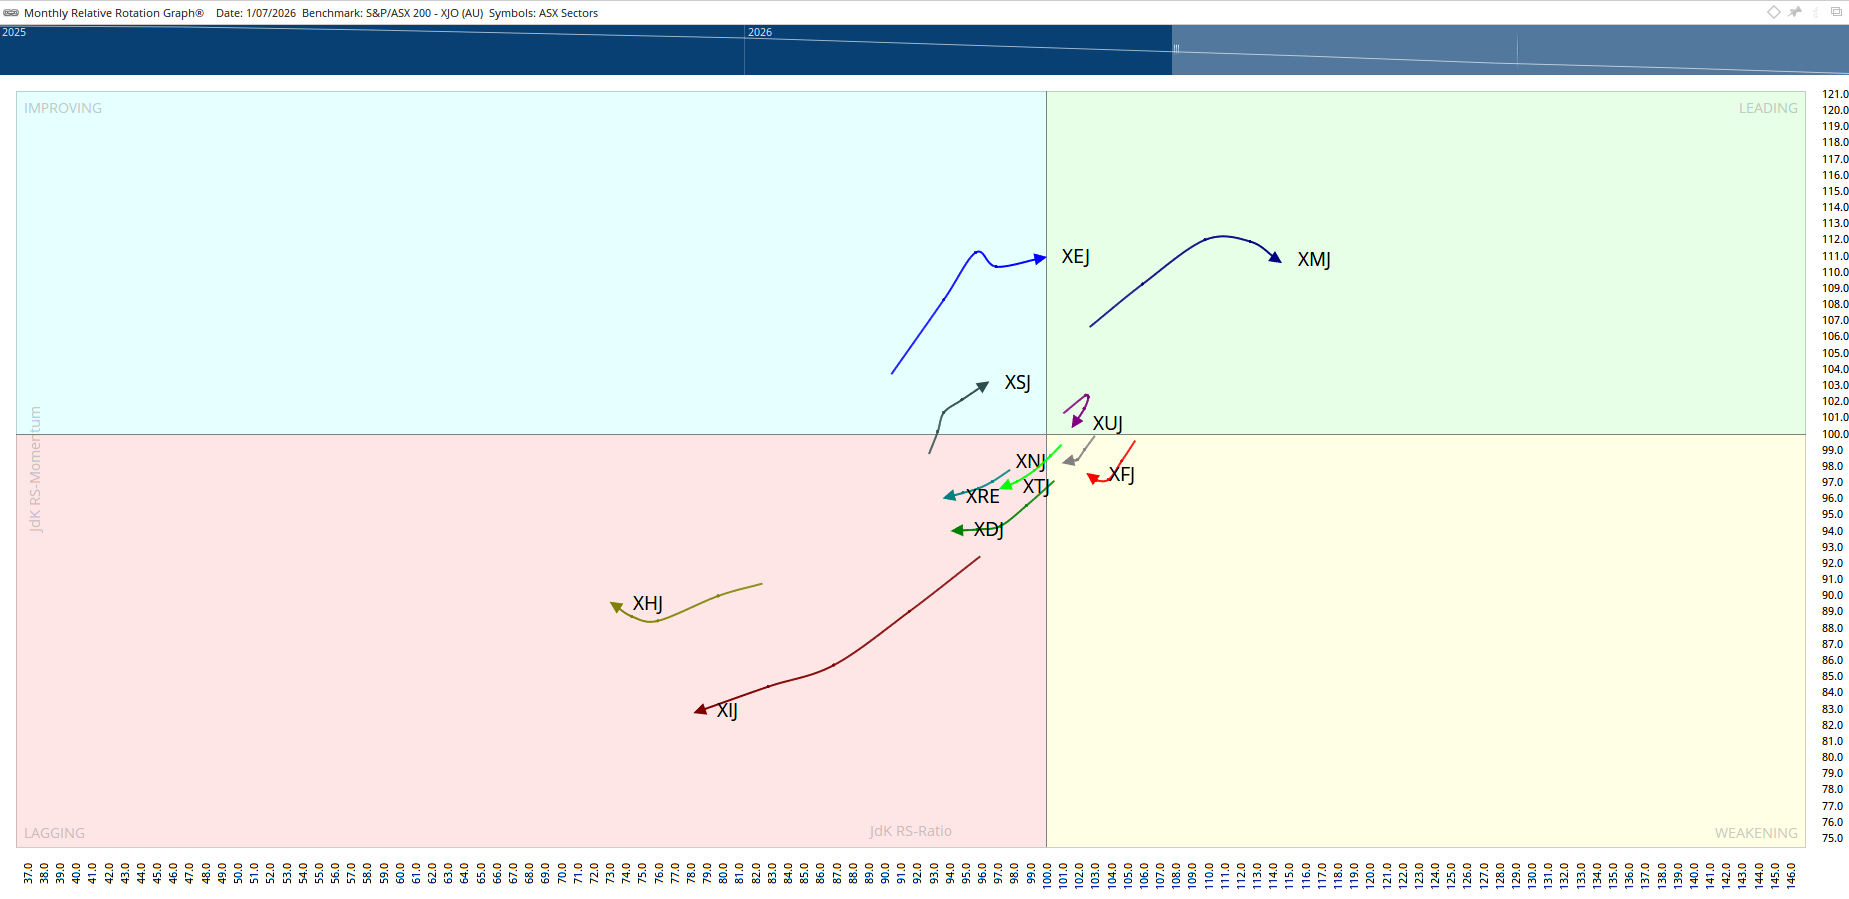
The relative rotation graph is showing several sectors currently lagging that could turn up and become tomorrow's leaders. Healthcare and consumer discretionary sit in the lagging quadrant, while consumer staples are moving into improving. Energy has already been moving, with rises across energy related stocks, although this hinges heavily on the oil price. Financials are pulling back but starting to turn, and insurance stocks have been running strongly as the market factors in the potential rate rise benefits.
Top Stock Picks for Reporting Season
South32 (S32)
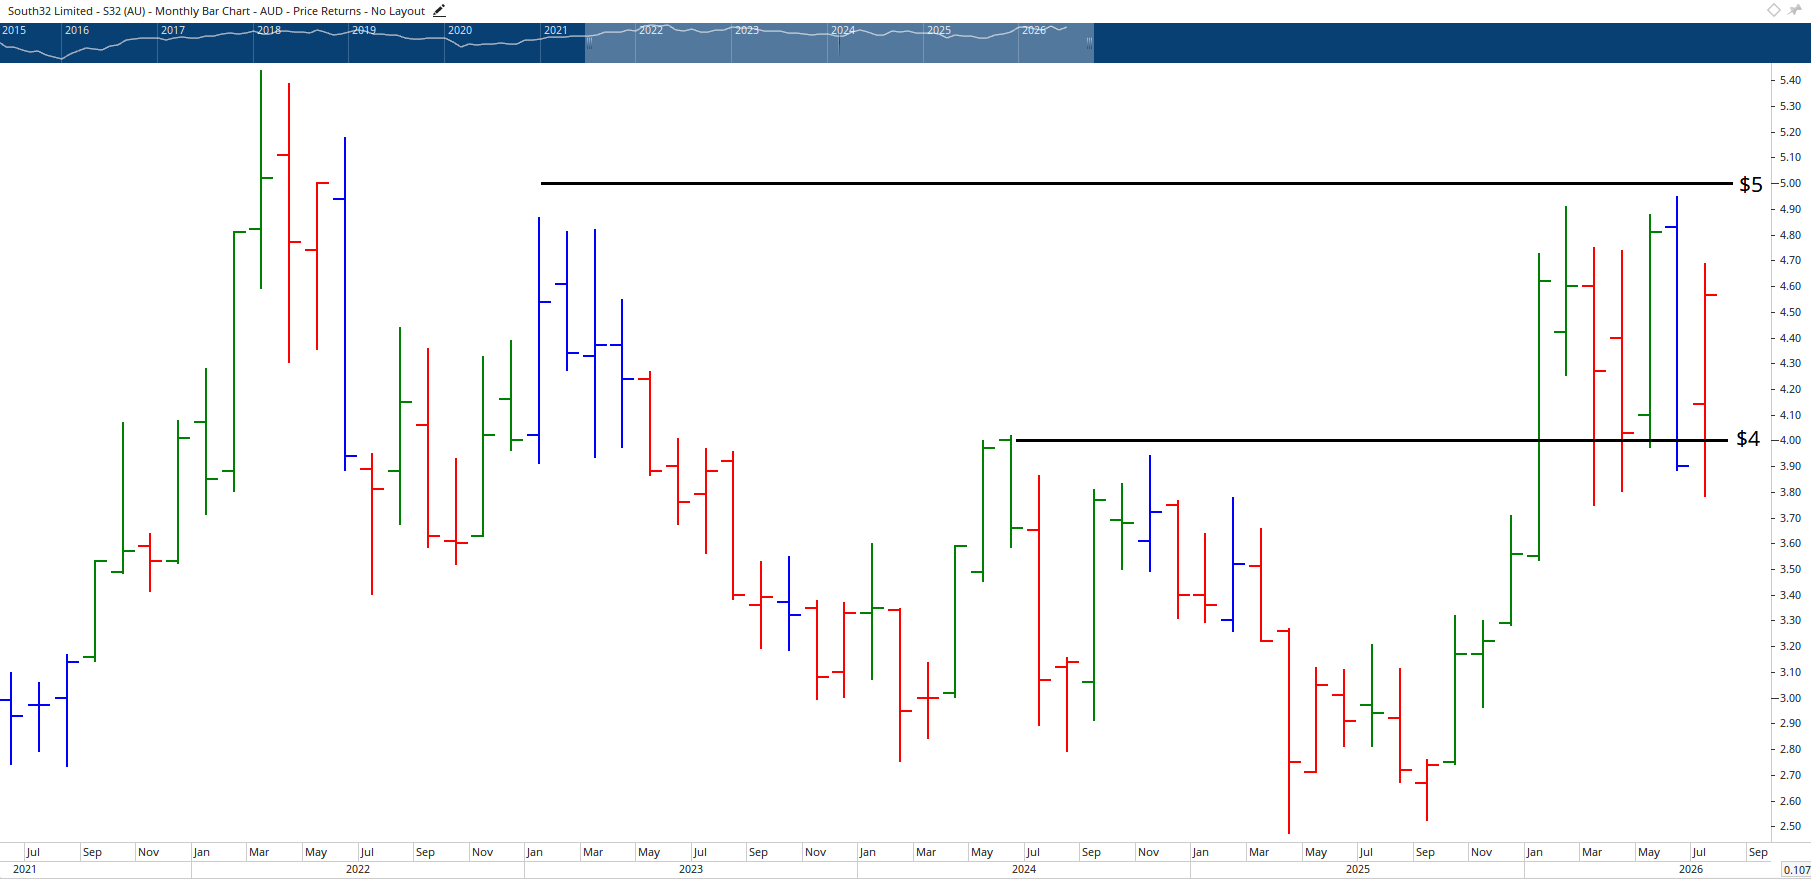
South32 has been consolidating sideways since January 2026, and this is fundamentally a copper story. Copper demand shows no signs of slowing, and if the reporting season delivers a positive catalyst, we could see a break above $5 with the stock heading towards its high. A move of 15 to 30% is possible, with 20% taking it through to a new all time high. As long as it holds above $4, the sideways move could still resolve to the upside.
Aurelia Metals (AMI)
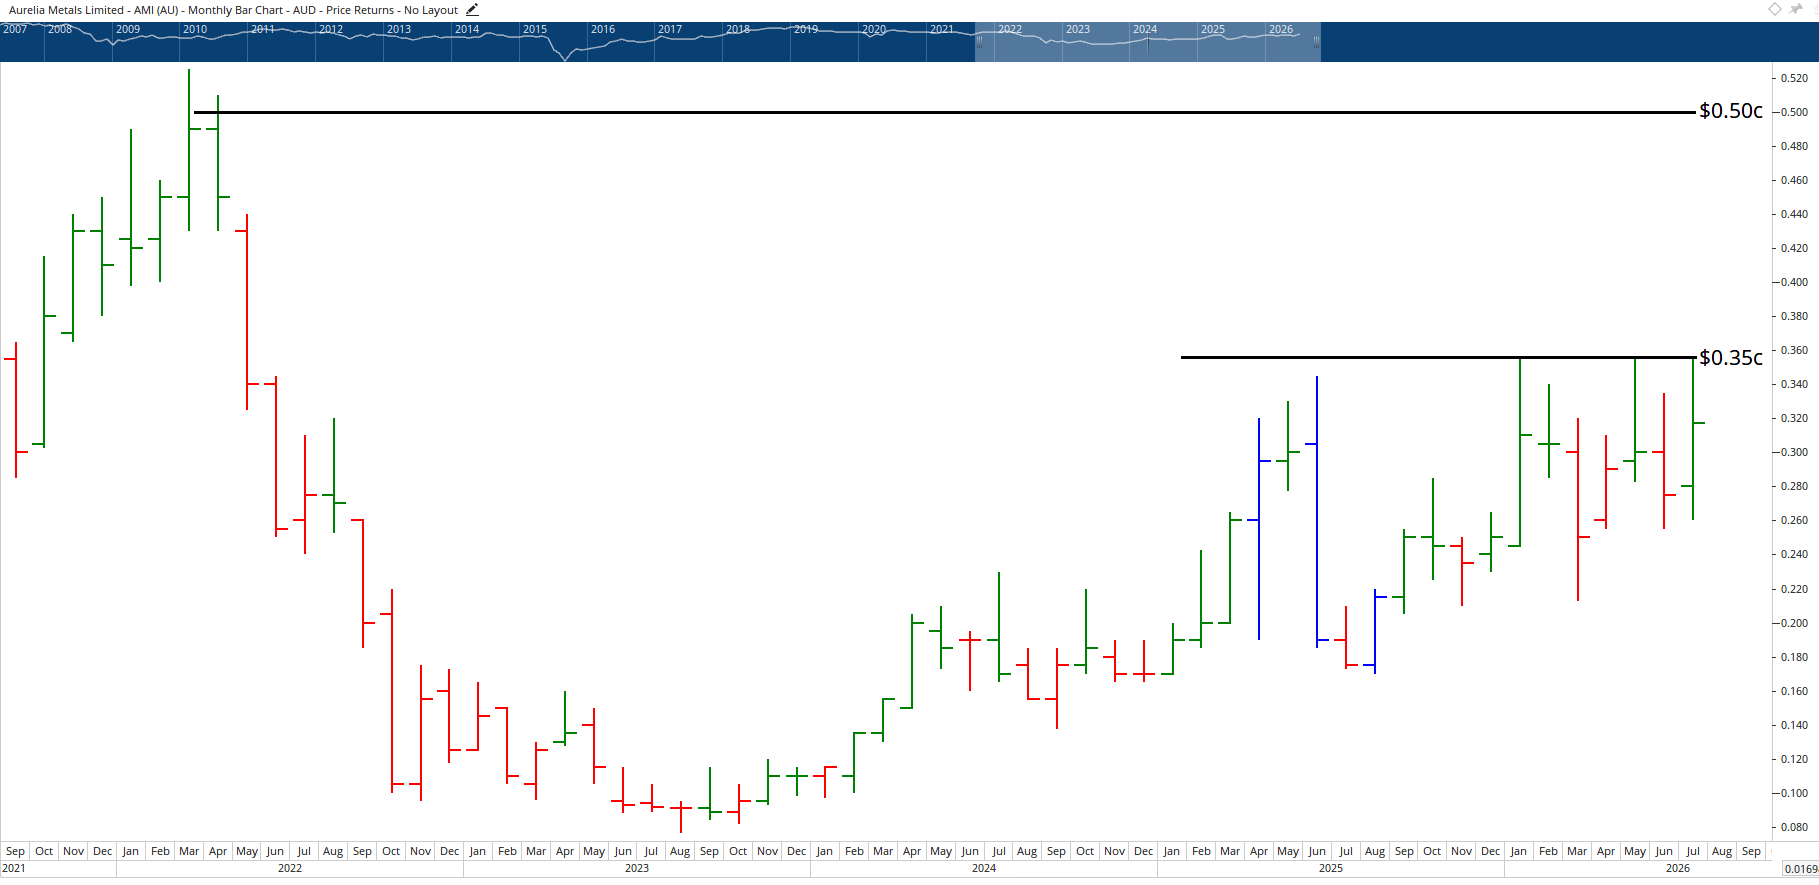
Aurelia Metals is another copper related play that has been setting up beautifully. There is significant resistance around the 34 to 35 cent mark, and a break above those levels could see the stock take off. If Aurelia surprises to the upside in reporting season, a 15 to 30% move is realistic, potentially heading up towards 50 cents.
Alcoa Corp (AAI)
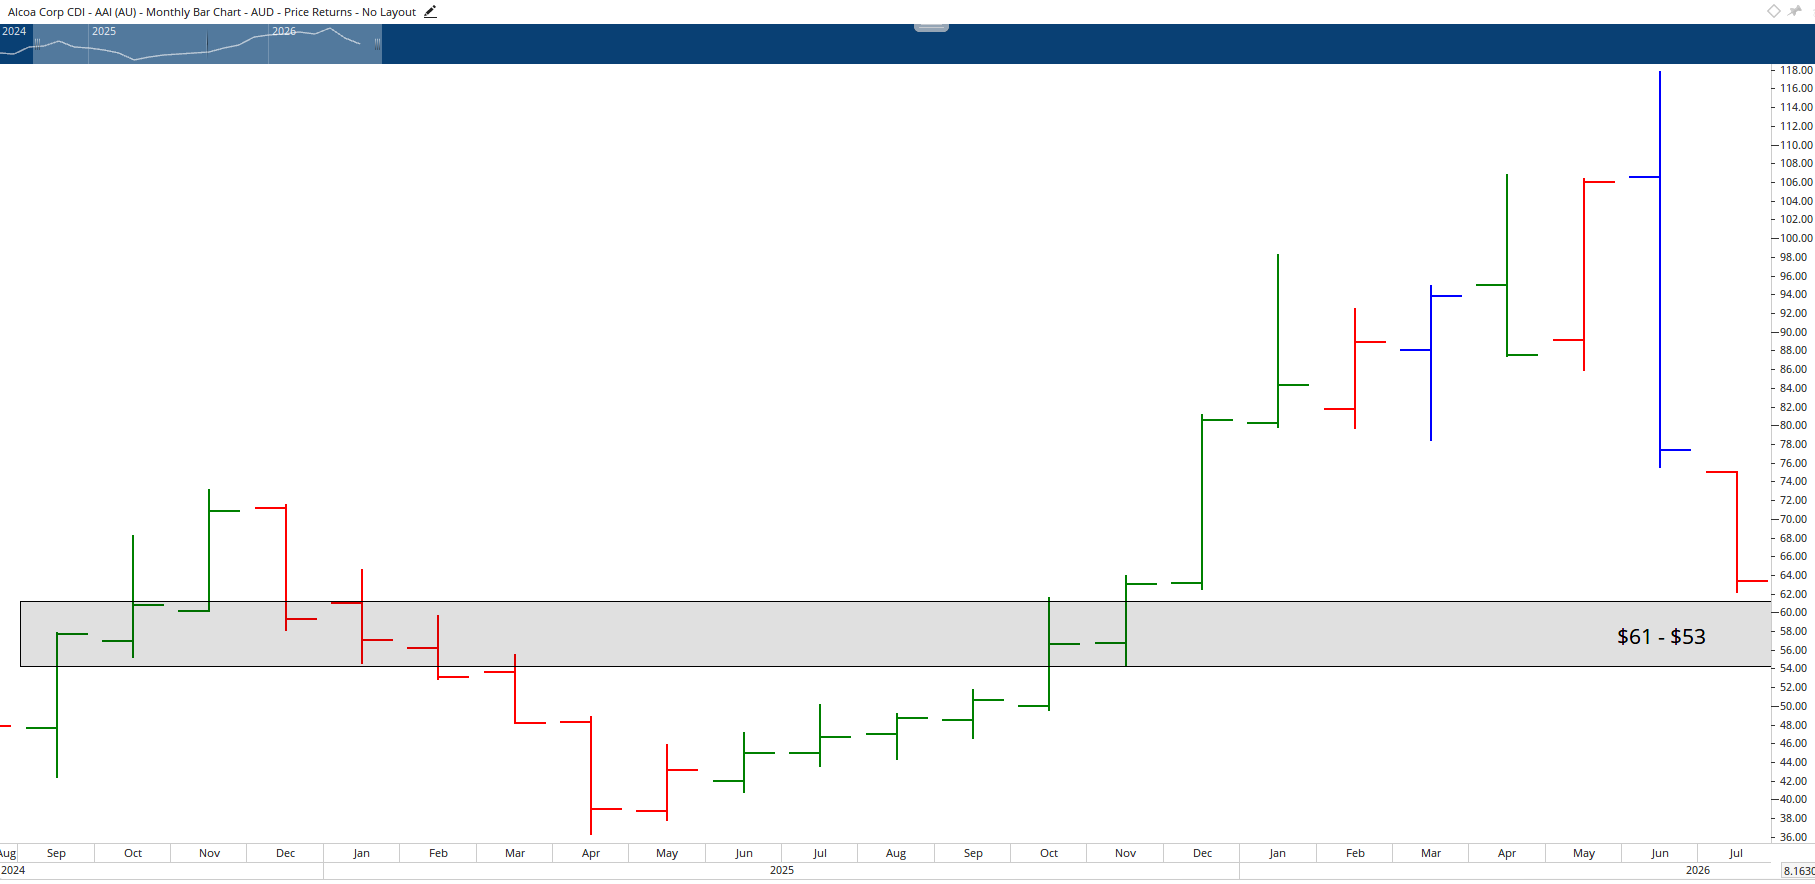
Alcoa is currently in a falling knife scenario, but there is a method to the madness. This aluminium play is benefiting from Middle East supply disruptions and strong underlying demand. Last quarter, Alcoa beat guidance and was profitable, so the recent share price weakness is at odds with fundamentals.
The stock is approaching a key value zone between $61 and $53, which represents both historical support and previous resistance. The fall from November 2024 to April 2025 was 50%, and the current fall is at 47%, suggesting a turnaround is close. Suitable as a short to medium term trade with confirmation required for a longer term position.
Greatland Resources (GGP)
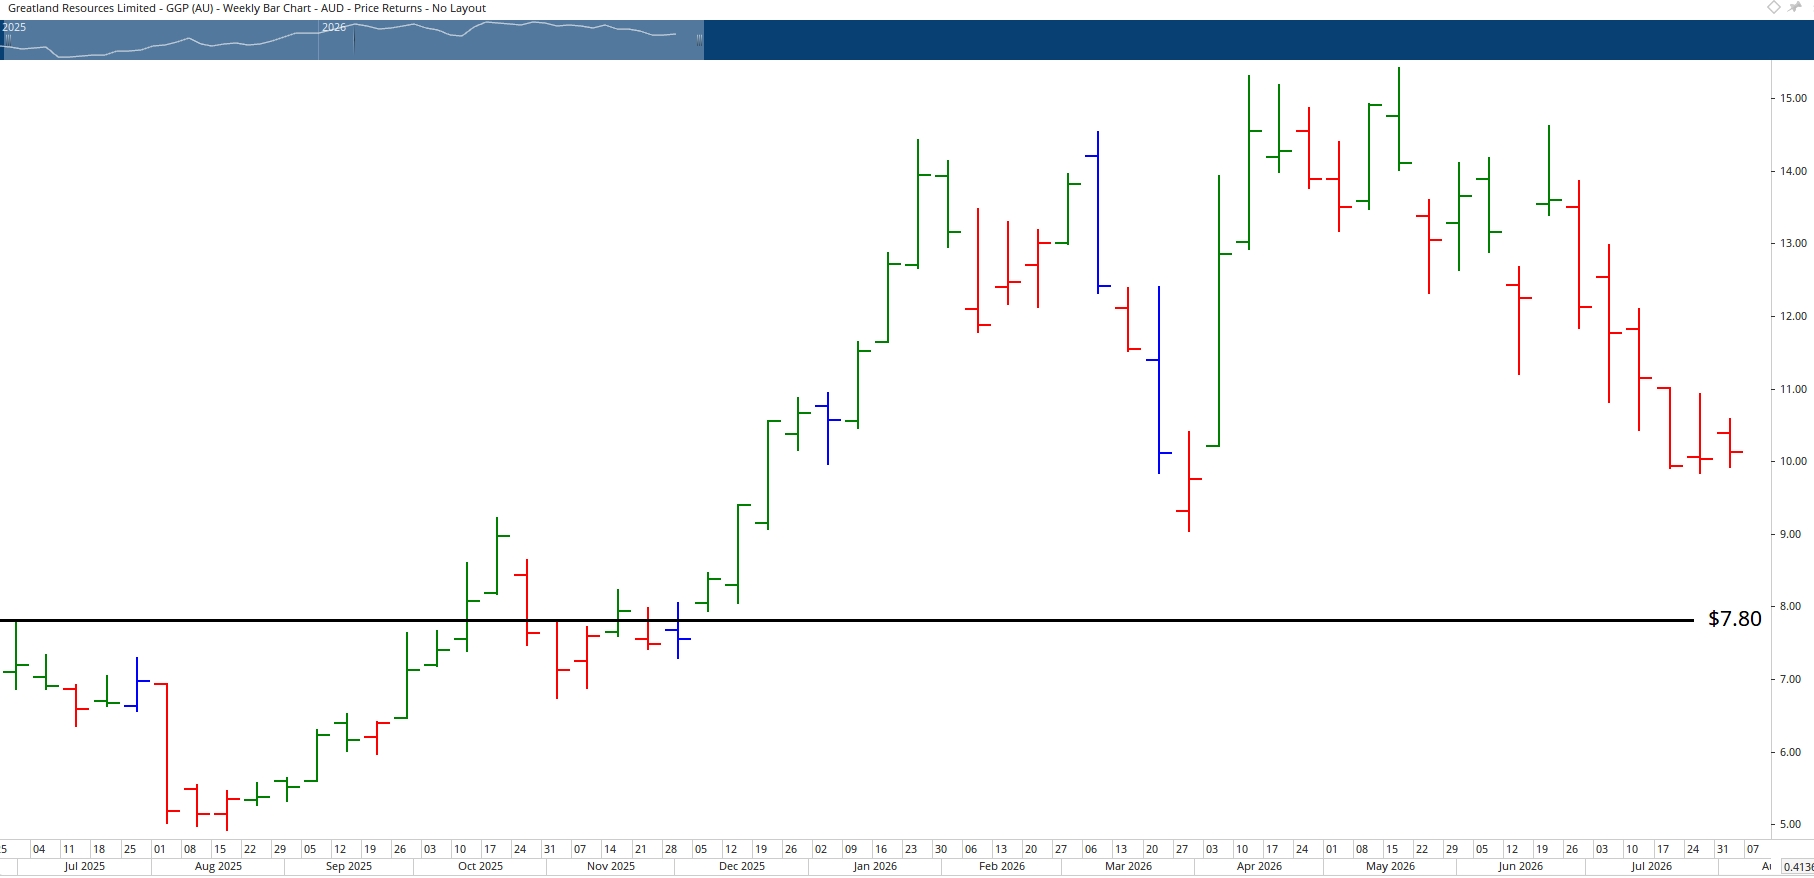
Greatland Resources sits in the gold and copper space and reported record revenue in its last quarter. The stock has been surprisingly weak given the strong fundamentals. A value zone has been identified around $7.80, which was the IPO high in June 2025, with additional support levels from March 2026 and resistance from October 2025.
Each successive low has been higher, so as long as the $9 low holds, the setup remains constructive. A break of the all time high near $15 would be very positive, but ideally investors want to be positioned before that move occurs.
Hot Stock Tip: IGO Limited (IGO)
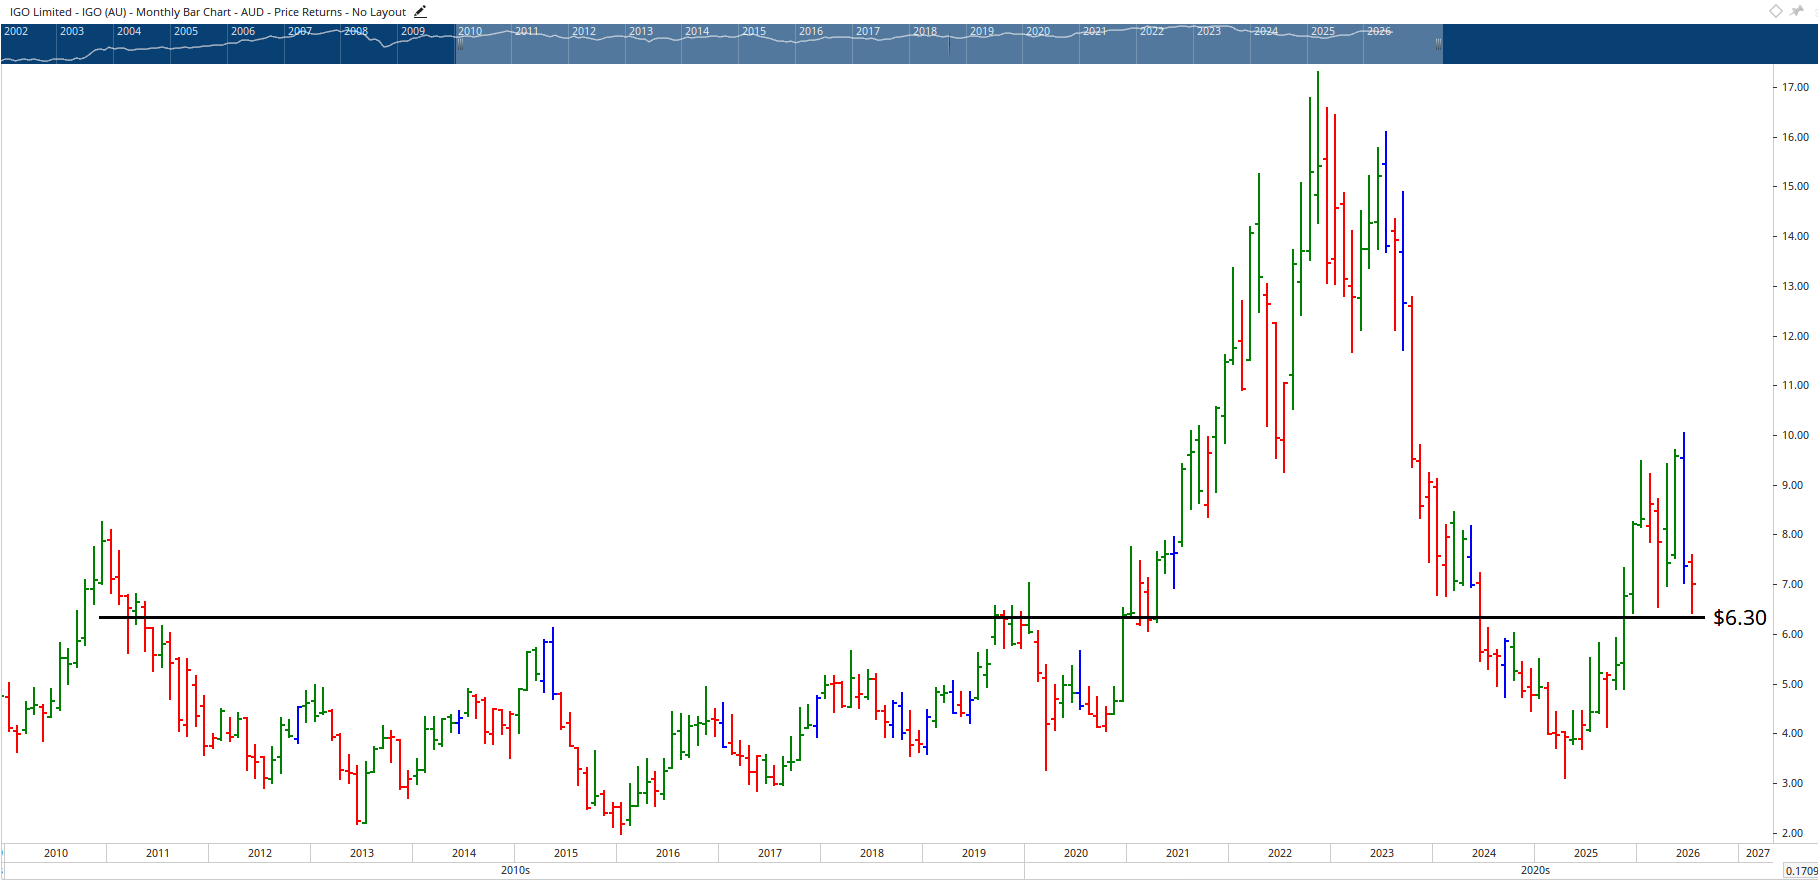
IGO Limited recently released a quarterly report showing an 18% lift in revenue to $141 million and a stronger cash position, driven by higher copper sales and solid performance from Greenbushes. While results were broadly positive, the Kwinana lithium refinery remains a drag with production well below capacity.
Interestingly, many investors think of IGO as a lithium play, but it is the copper business doing the heavy lifting. The chart looks very compelling. IGO has broken through significant congestion between $6.30 and $2.40 and is holding up nicely above it. The stock is respecting the $6.40 level, which has been an important resistance turned support level dating back to November 2025 and March 2026. With the full-year report ahead, IGO is one to keep on the radar.
The Bigger Lesson: Trade with Skill, Not Luck
The theme running through this reporting season, and every reporting season, is that skill and preparation separate successful investors from the rest. Whether it is understanding sector rotation, reading a chart with clarity, setting a clear stop loss, or knowing when to take profits, these are learnable skills.
For those just starting out, the Short Course in Share Trading offers a solid grounding in the essentials. Those looking to take their trading to a professional level should consider the government-accredited Diploma of Share Trading and Investment.
Reporting season is one of the most exciting periods on the market calendar. With the right knowledge, the right analysis, and the right strategy, it can also be one of the most rewarding.